USD/INR Price Analysis: Positive Divergence bolsters a bullish reversal, 83.00 eyed
- The greenback bulls are facing barricades at the downward sloping trendline placed from 83.30.
- A Positive Divergence signals a resumption in the dominant trend after a corrective move.
- The DXY is struggling to sustain above 110.50 amid mixed market sentiment.
The USD/INR pair is struggling to cross the immediate hurdle of 82.40 in the Tokyo session. However, the US dollar index (DXY) has witnessed a minor correction after failing to sustain above the critical resistance of 110.50. Meanwhile, risk sentiment remains quiet as S&P500 futures are holding their morning losses.
USD/INR daily chart
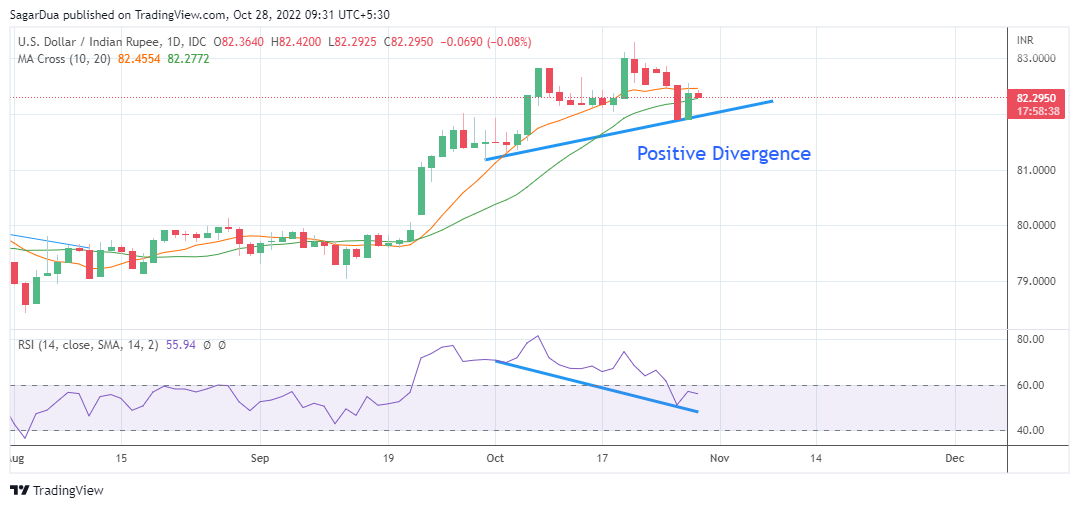
On a daily scale, the major has displayed a Positive Divergence, which indicates a resumption of an uptrend after a corrective move. A bullish positive divergence was recorded after the asset made a higher low at around 81.90 while the momentum oscillator Relative Strength Index (RSI) (14) made a lower low. This dictates an oversold situation in an uptrend which is considered a bargain buy for the market participants.
The 10- and 20-period Exponential Moving Averages (EMAs) at 82.47 and 82.25 respectively are aiming higher, which adds to the upside filters.
USD/INR hourly chart
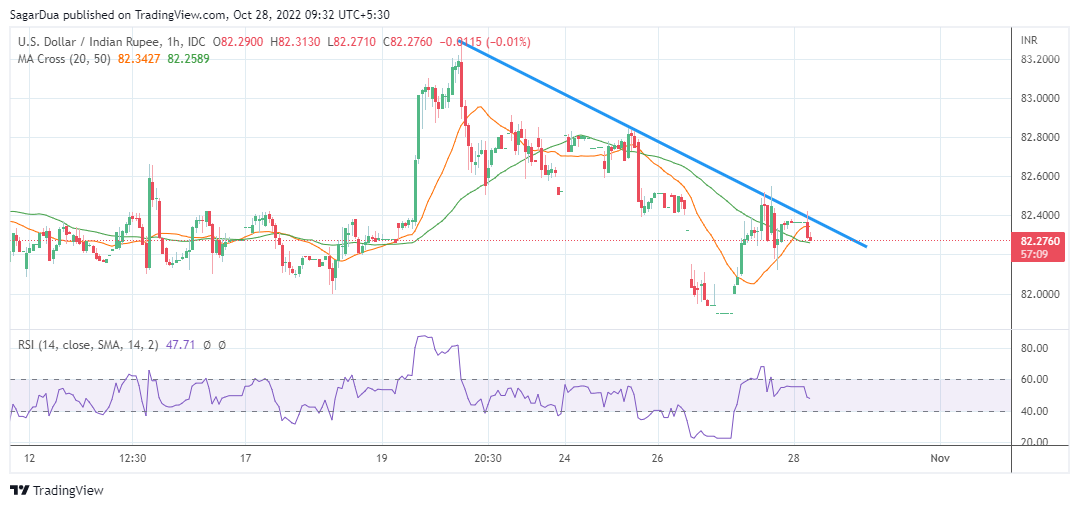
On an hourly scale, the major is facing barricades around the downward-sloping trendline placed from October 20 high at 83.30.
The 20-and-50-period EMAs have delivered a bull cross at 82.34, which indicates more upside ahead.
A decisive move above Thursday’s high at 82.55 will trigger the Positive Divergence and eventually will activate the greenback bulls for an upside move towards October 10 high and all-time high at 82.82 and 83.30 respectively.
Alternatively, the Positive Divergence formation could negate if the asset drops below Thursday’s low at 81.90. This will drag the asset towards October 6 low at 81.51, followed by September 30 low at 81.16.
USD/INR