Back
28 Mar 2023
GBP/USD Price Analysis: Bulls need to get over the line
- Bulls are in the market and a break of the equal highs near 1.2450 opens risk to the 1.2670's.
- GBP/USD bulls press up against neckline resistance.
GBPUSD increased to a 7-week high of 1.2349, a key area of resistance as the following charts will illustrate.
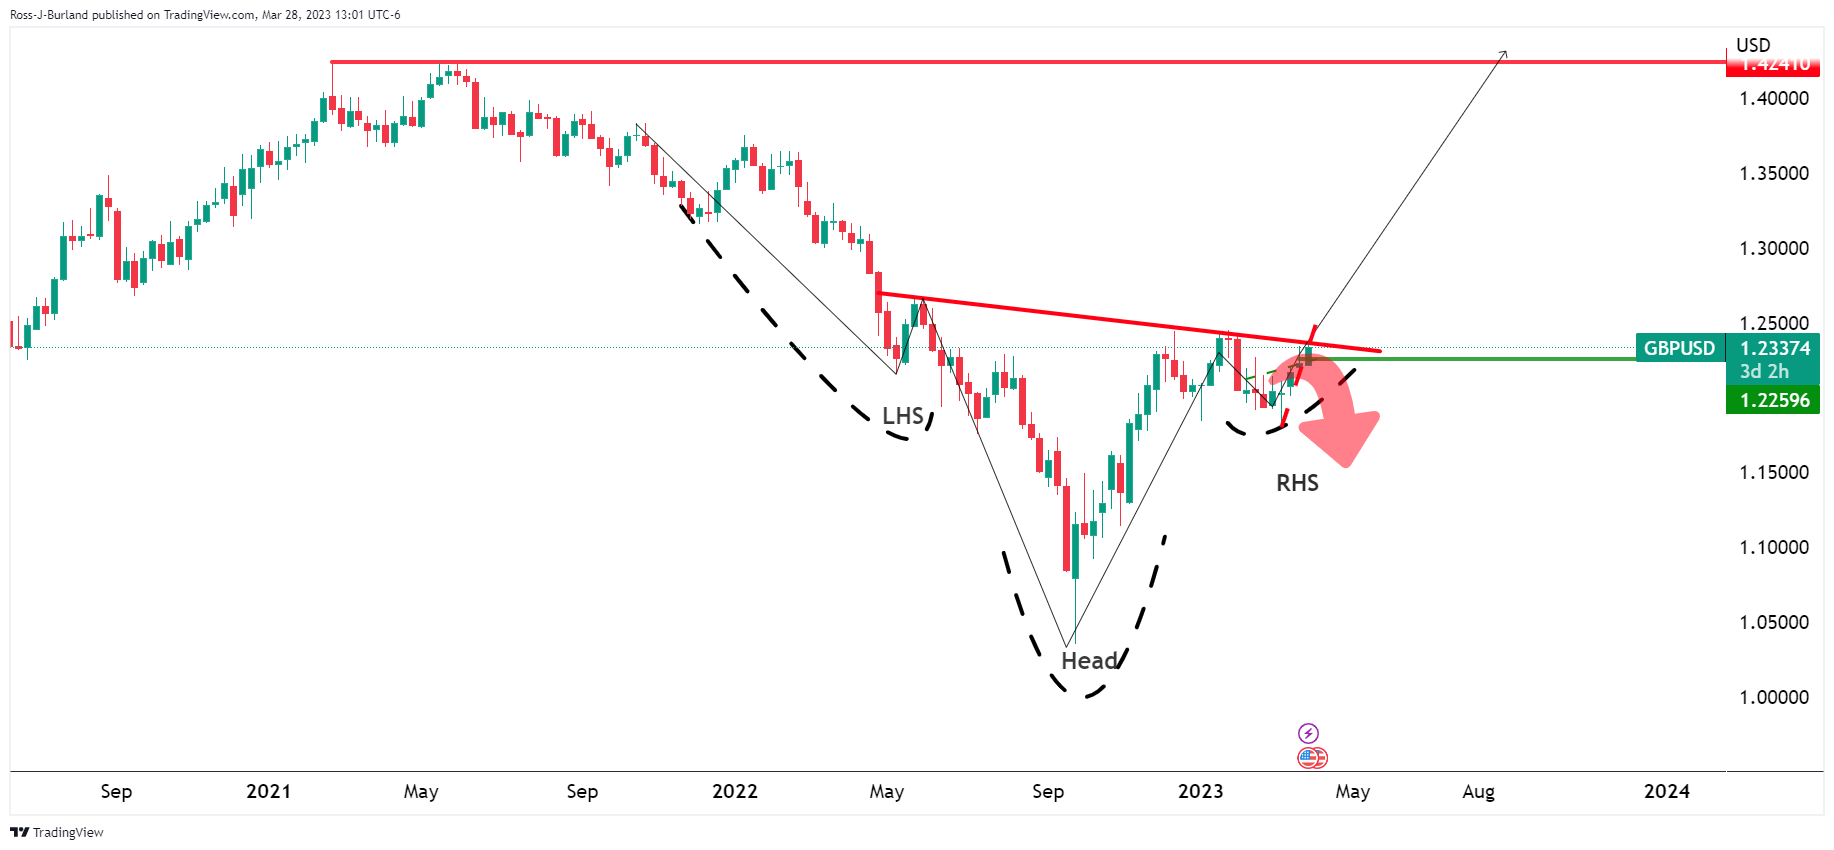
GBP/USD weekly charts
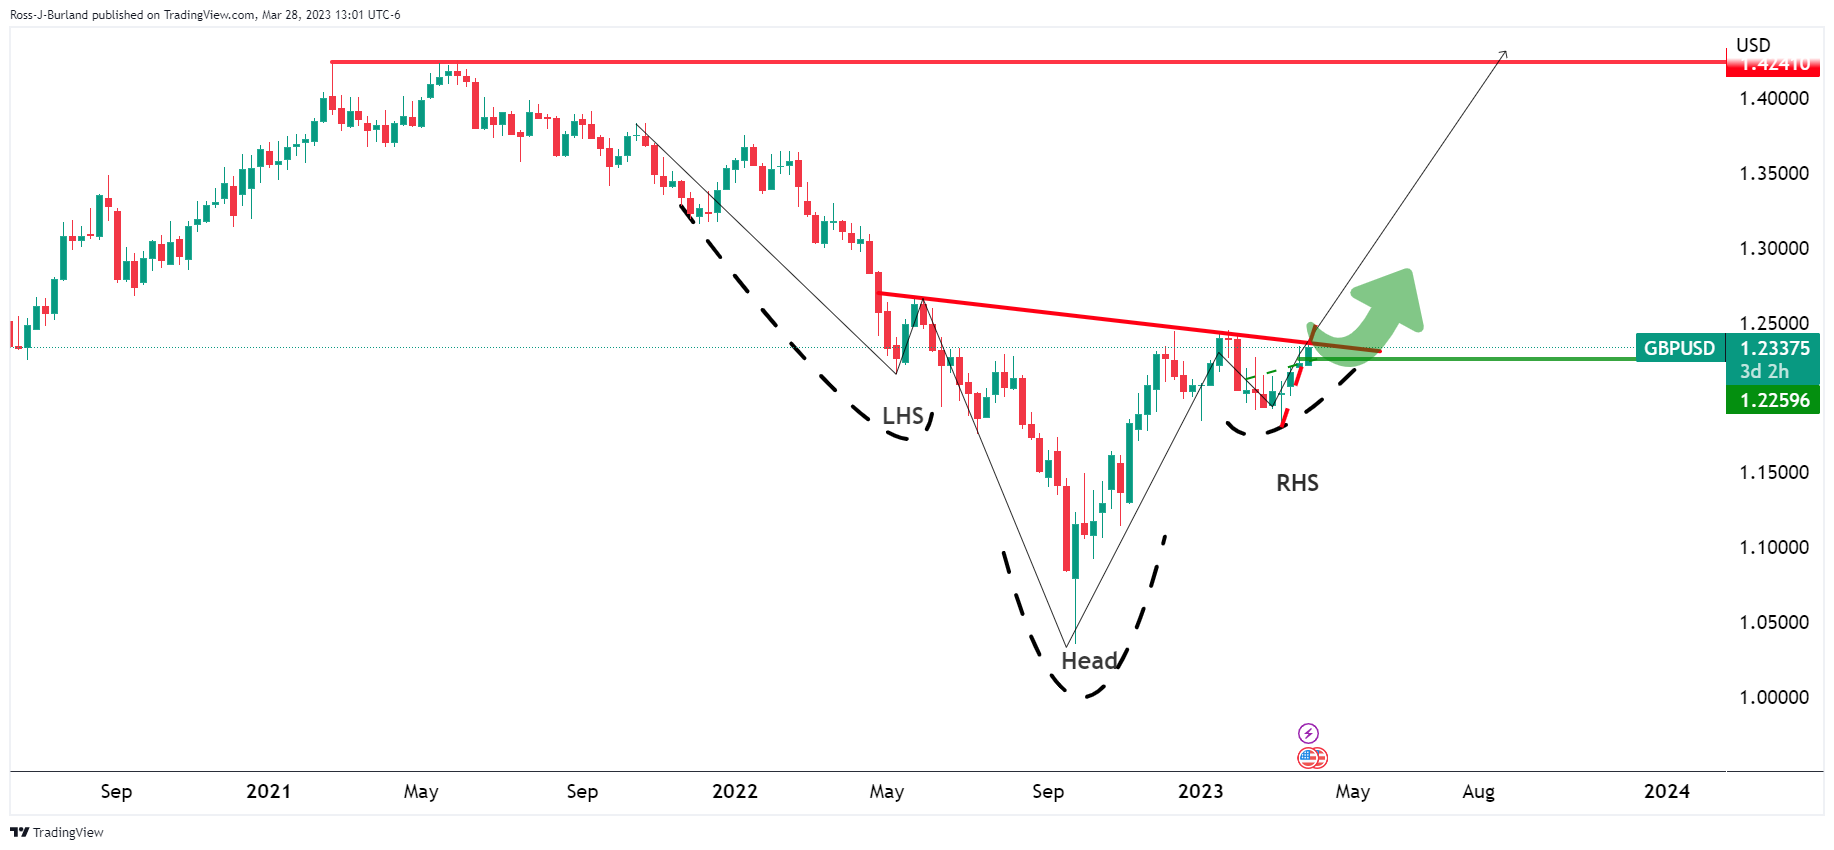
The inverse head and shoulders pattern is bullish but the price is yet to break the neckline resistance and could easily reverse course and head lower.
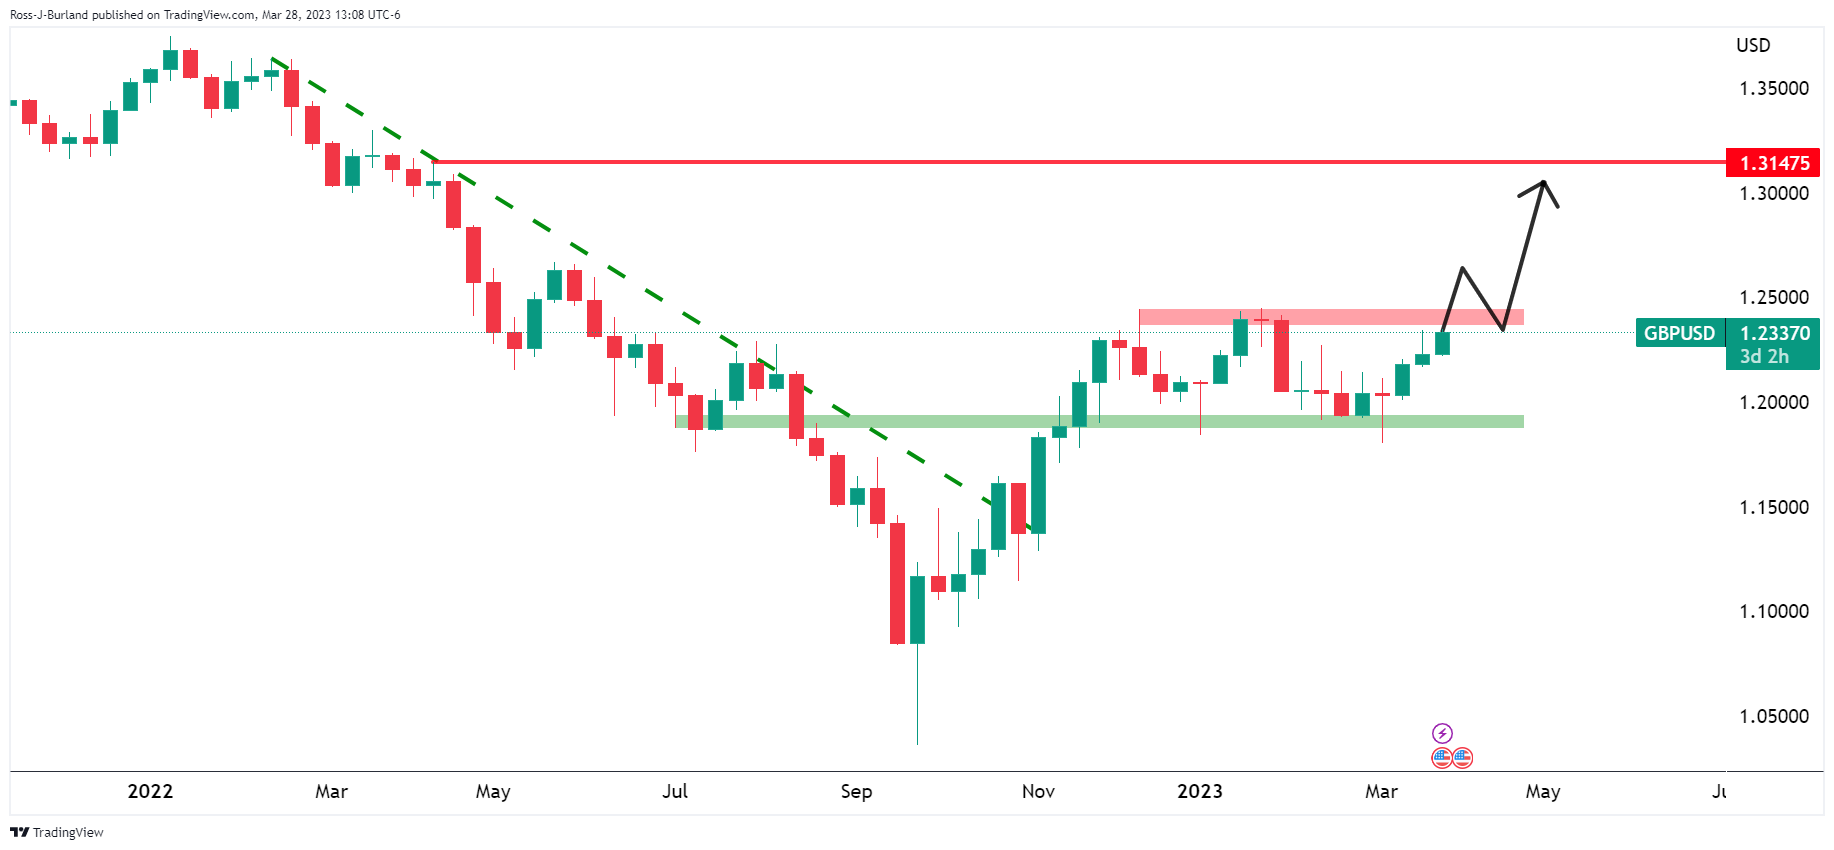
On the other hand, if the bulls can get above the neckline and break the 1.2500 area, they will be in the runnings for an extended move toward the 1.3150s:
AUD/USD daily chart
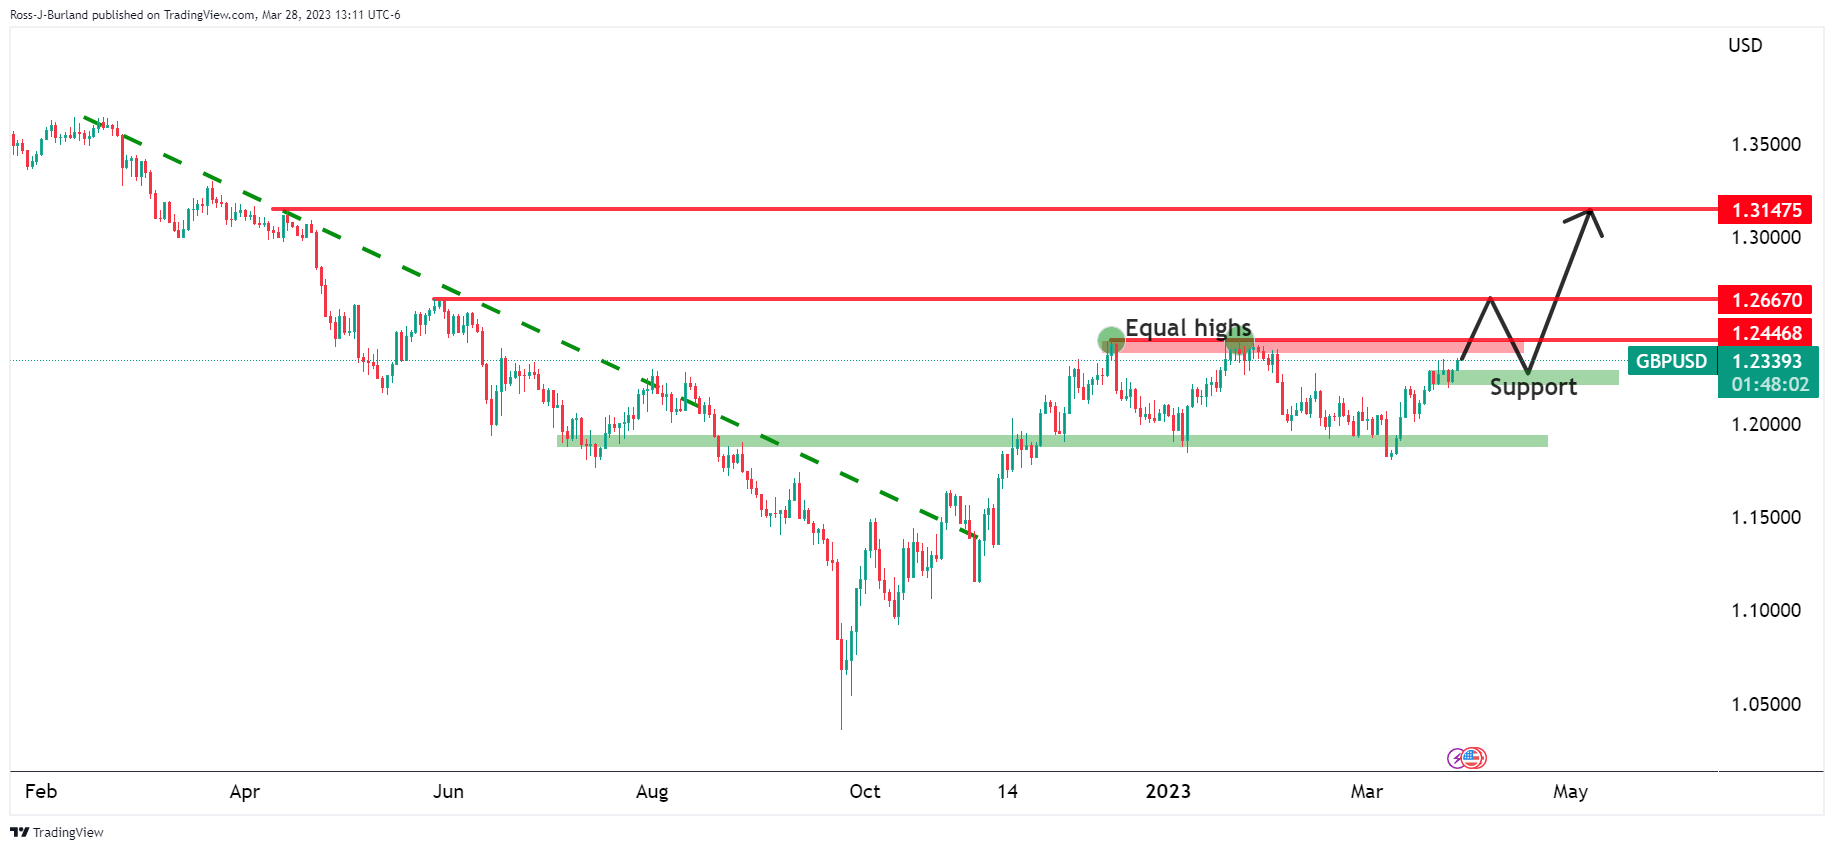
Bulls are in the market and a break of the equal highs near 1.2450 opens risk to the 1.267's and should bulls commit above 1.2200, then there will be prospects of a move towards 1.3150.