Confirming you are not from the U.S. or the Philippines

Bằng cách đưa ra quyết định này, tôi tuyên bố rõ ràng và xác nhận rằng:
  • Tôi không phải là công dân hoặc cư dân Hoa Kỳ
  • Tôi không phải là cư dân của Philippines
  • Tôi không trực tiếp hoặc gián tiếp sở hữu hơn 10% cổ phần/quyền biểu quyết/lợi ích của cư dân Hoa Kỳ và/hoặc không kiểm soát công dân hoặc cư dân Hoa Kỳ bằng các phương thức khác
  • Tôi không thuộc quyền sở hữu trực tiếp hoặc gián tiếp hơn 10% cổ phần/quyền biểu quyết/lợi ích và/hoặc dưới sự kiểm soát của công dân hoặc cư dân Hoa Kỳ được thực hiện bằng các phương thức khác
  • Tôi không liên kết với công dân hoặc cư dân Hoa Kỳ theo Mục 1504(a) của FATCA
  • Tôi nhận thức được trách nhiệm của mình khi khai báo gian dối.
Theo mục đích của tuyên bố này, tất cả các quốc gia và vùng lãnh thổ phụ thuộc của Hoa Kỳ đều ngang bằng với lãnh thổ chính của Hoa Kỳ. Tôi cam kết bảo vệ và giữ cho Octa Markets Incorporated, giám đốc và cán bộ của công ty vô hại chống lại bất kỳ khiếu nại nào phát sinh từ hoặc liên quan đến bất kỳ hành vi vi phạm tuyên bố nào của tôi bằng văn bản này.
Back

NZD/USD Price Analysis: Bearish stance persists and bulls are running out of time

  • The NZD/USD maintains a bearish stance while showing a flattening buying momentum on both daily and hourly charts.
  • The bulls got rejected again by the 20-day SMA.
  • Any upward movement that fails to conquer the mentioned SMA shouldn’t be considered a buying signal.

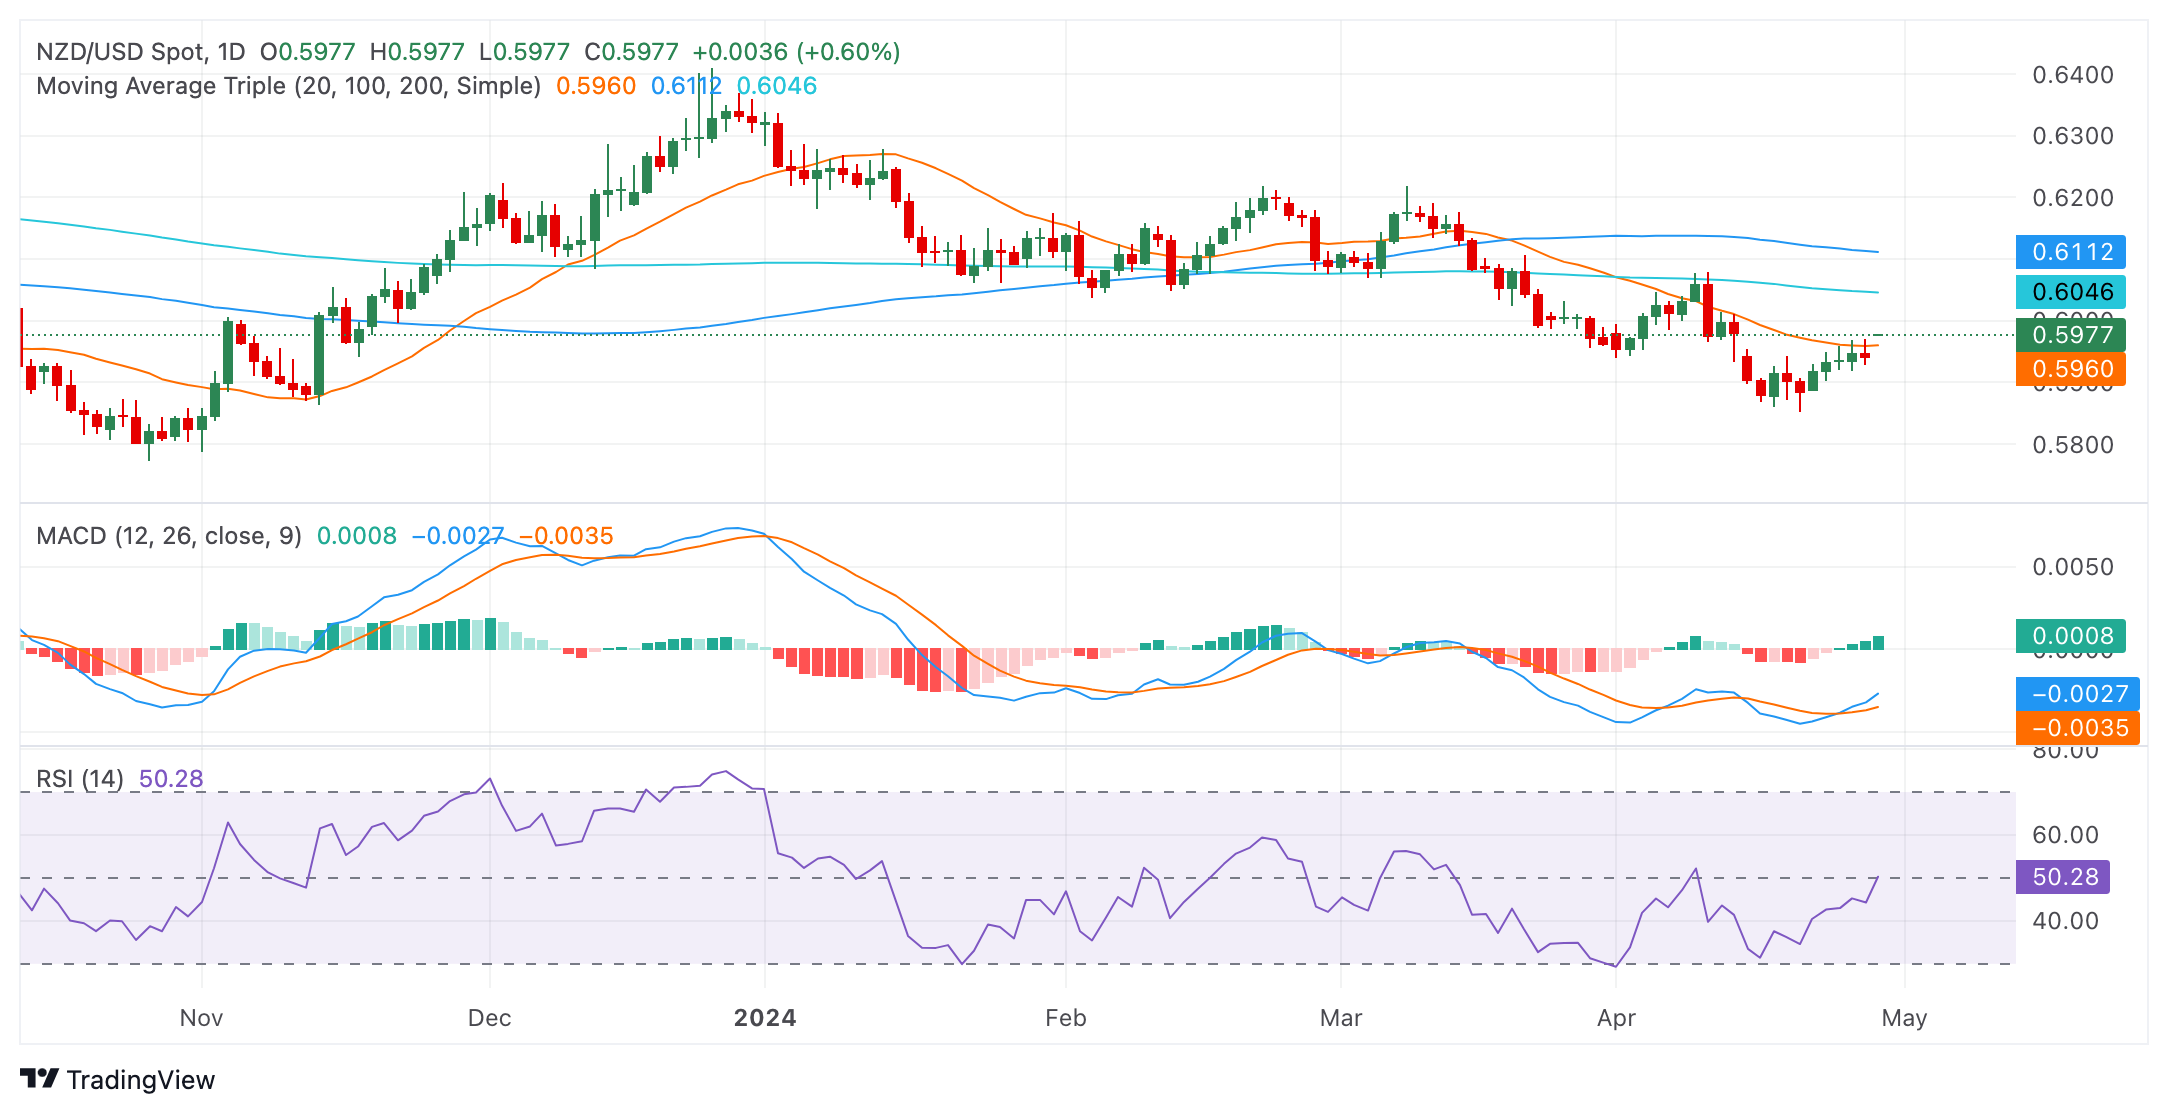
The NZD/USD pair rallied to 0.5980 on Monday and then stabilized around 0.5960, yet maintains a bearish outlook. While recent movements have shown increased buying momentum, significant positioning beneath key Simple Moving Averages (SMAs) indicates a larger bearish bias and as long as the pair is kept below this levels, the outlook will remain in favor of the bears.

On the daily chart, the Relative Strength Index (RSI) indicates a positive trend for the NZD/USD pair. From the oversold territory, the index is now on its way to its middle point, demonstrating an increase in buying momentum. The Moving Average Convergence Divergence (MACD) histogram displays flat green bars, suggesting steady positive momentum with buyers dominating the market but warns of a flattening buying traction.

NZD/USD daily chart
Transitioning to the hourly chart, the RSI maintains a positive outlook, hovering around the 57 mark but is currently pointing down, suggesting that the buyers are running out of steam in this timeframe. The MACD shows flat green bars, pointing to a more cautious uptrend.

NZD/USD hourly chart
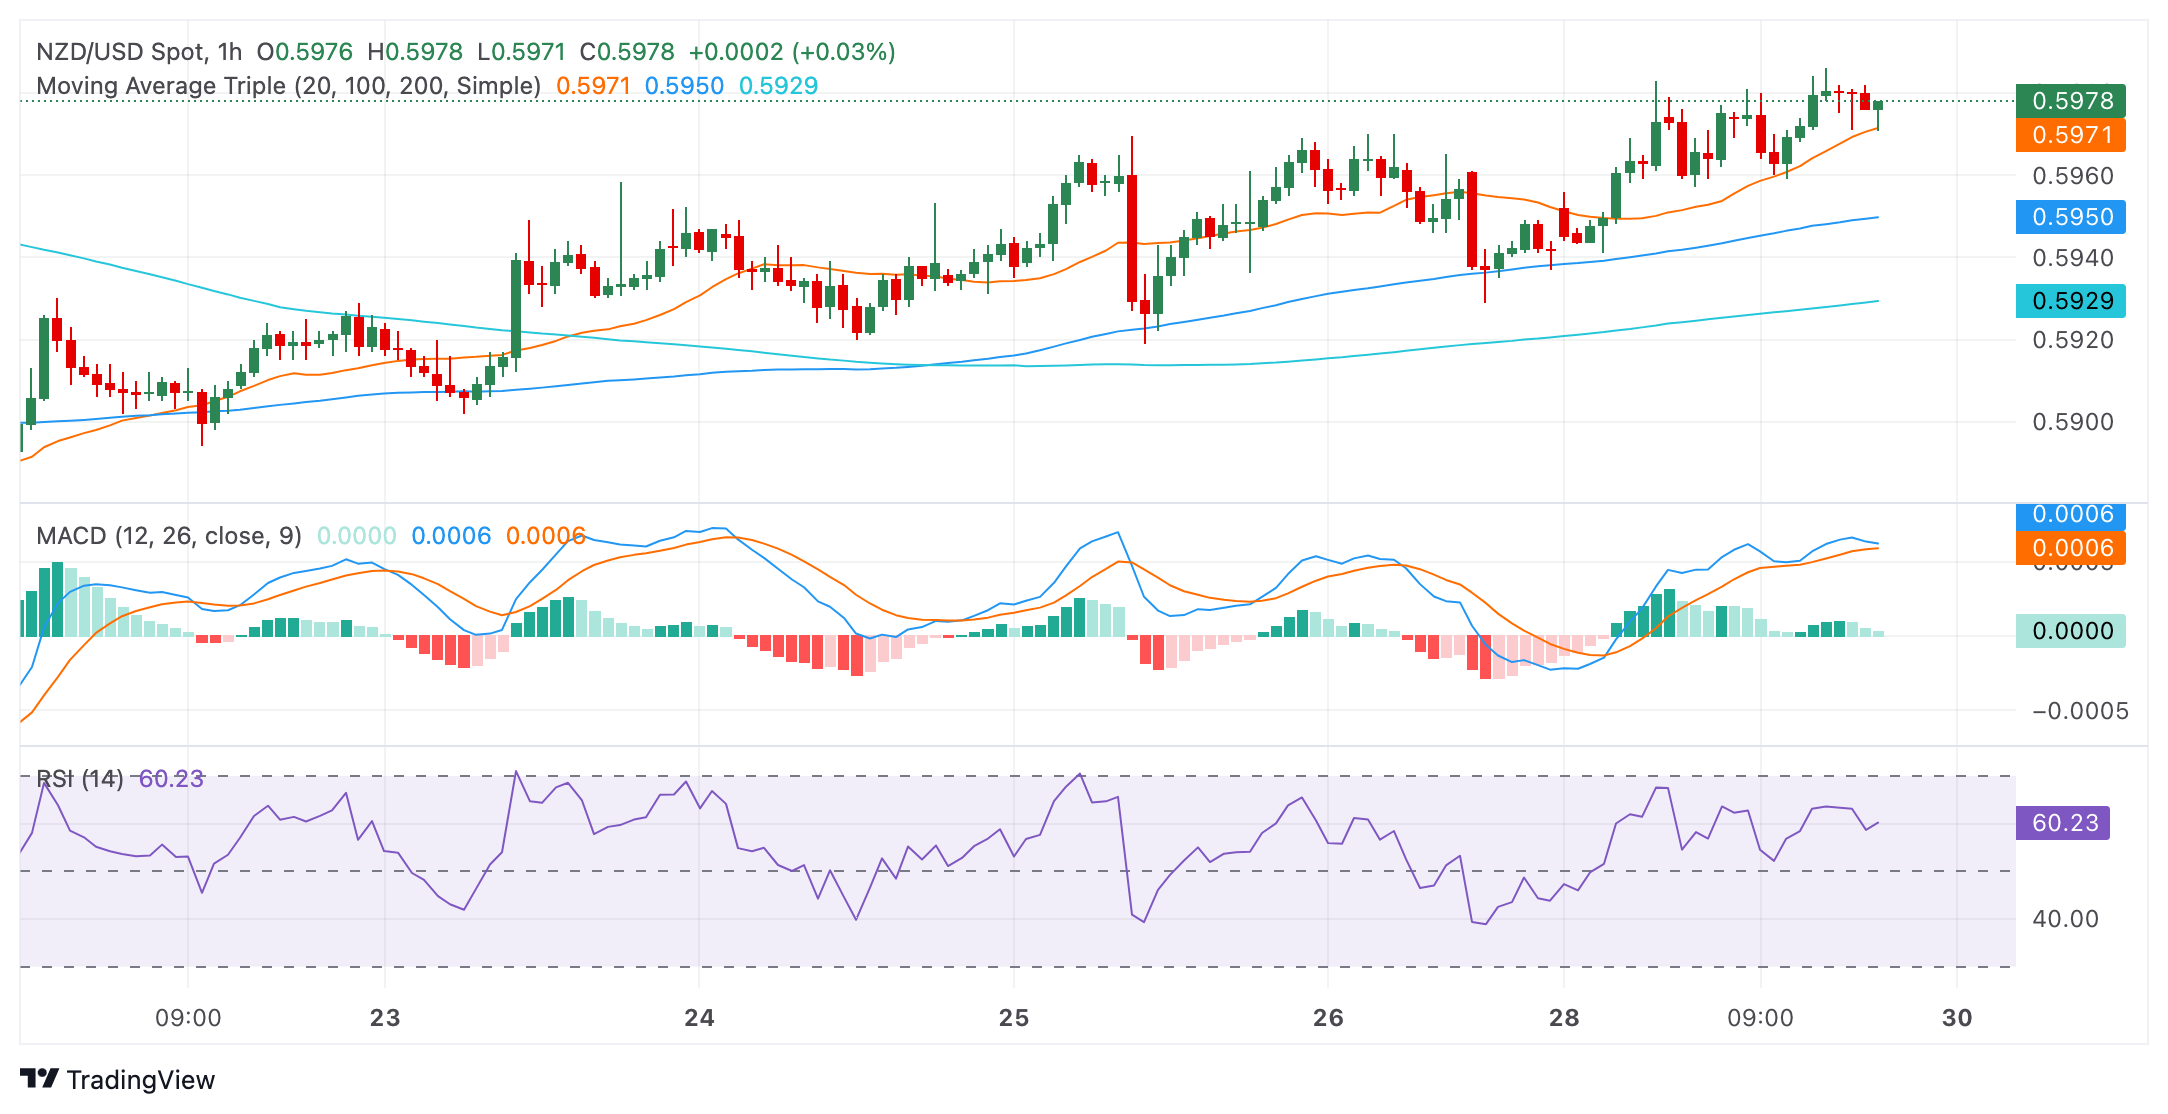
While analyzing the broader scope, the pair currently sits in a bearish posture. The Kiwi's position below its 20, 100, and 200-day Simple Moving Average (SMA), indicates an overall downtrend. The 20-day SMA rejected the buyers at the 0.596 mark on Monday, which could discourage bullish traders. However, ahead of the Asian session, buyers might make an additional stride to recover that level which could brighten the outlook for the pair.


NZD/USD

Overview
Today last price 0.5976
Today Daily Change 0.0034
Today Daily Change % 0.57
Today daily open 0.5942
 
Trends
Daily SMA20 0.5959
Daily SMA50 0.6045
Daily SMA100 0.6113
Daily SMA200 0.6047
 
Levels
Previous Daily High 0.597
Previous Daily Low 0.5929
Previous Weekly High 0.597
Previous Weekly Low 0.5886
Previous Monthly High 0.6218
Previous Monthly Low 0.5956
Daily Fibonacci 38.2% 0.5945
Daily Fibonacci 61.8% 0.5954
Daily Pivot Point S1 0.5924
Daily Pivot Point S2 0.5906
Daily Pivot Point S3 0.5883
Daily Pivot Point R1 0.5965
Daily Pivot Point R2 0.5988
Daily Pivot Point R3 0.6006


GBPJPY settles near 196.00 after volatile Monday, falls back from 34-year high

The GBP/JPY tumbled nearly 3.5% from the day’s 34-year peak at 200.60, rallying to its highest bids since August of 2008 before a rapid pullback, sending the pair down nearly 700 pips on Monday before markets recovered to the 196.00 technical region.
Đọc thêm Previous

EUR/USD finds support near 1.0720 after slow grind on Monday

EUR/USD jostled on Monday, settling near 1.0720 after churning in a tight but lopsided range as markets settle in for the wait to Wednesday’s US Federal Reserve (Fed) outing.
Đọc thêm Next