Confirming you are not from the U.S. or the Philippines

Bằng cách đưa ra quyết định này, tôi tuyên bố rõ ràng và xác nhận rằng:
  • Tôi không phải là công dân hoặc cư dân Hoa Kỳ
  • Tôi không phải là cư dân của Philippines
  • Tôi không trực tiếp hoặc gián tiếp sở hữu hơn 10% cổ phần/quyền biểu quyết/lợi ích của cư dân Hoa Kỳ và/hoặc không kiểm soát công dân hoặc cư dân Hoa Kỳ bằng các phương thức khác
  • Tôi không thuộc quyền sở hữu trực tiếp hoặc gián tiếp hơn 10% cổ phần/quyền biểu quyết/lợi ích và/hoặc dưới sự kiểm soát của công dân hoặc cư dân Hoa Kỳ được thực hiện bằng các phương thức khác
  • Tôi không liên kết với công dân hoặc cư dân Hoa Kỳ theo Mục 1504(a) của FATCA
  • Tôi nhận thức được trách nhiệm của mình khi khai báo gian dối.
Theo mục đích của tuyên bố này, tất cả các quốc gia và vùng lãnh thổ phụ thuộc của Hoa Kỳ đều ngang bằng với lãnh thổ chính của Hoa Kỳ. Tôi cam kết bảo vệ và giữ cho Octa Markets Incorporated, giám đốc và cán bộ của công ty vô hại chống lại bất kỳ khiếu nại nào phát sinh từ hoặc liên quan đến bất kỳ hành vi vi phạm tuyên bố nào của tôi bằng văn bản này.
Back

EUR/USD Price Analysis: Pair slides below 1.0300, indicators lose steam

  • EUR/USD declines by 0.48% on Wednesday, settling near 1.0295 after failing to break above the 20-day SMA.
  • RSI falls sharply to 39 in negative territory, revealing intensified selling pressure.
  • MACD histogram prints decreasing green bars, suggesting waning bullish momentum and a renewed downside tilt.

EUR/USD struggled on Wednesday, shedding 0.48% to trade around 1.0295. This latest drop underscores the pair’s inability to sustain any meaningful recovery, as multiple attempts to breach the 20-day Simple Moving Average (SMA) since early 2025 have been met with forceful selling. As a result, bullish momentum appears to be receding, leaving sellers firmly in control of the near-term price action.

Technical readings paint a downbeat picture. The Relative Strength Index (RSI) has dropped to 39, reinforcing the notion that downward pressure is picking up pace. Meanwhile, the Moving Average Convergence Divergence (MACD) histogram shows a decline in green bars, hinting that any previous efforts by buyers have begun to fade. Despite these setbacks, a definitive move above the 20-day SMA would still represent the clearest signal of a reversal, should buyers regroup and attempt another push higher.

Until that materializes, however, the path of least resistance remains tilted to the downside. Traders will keep a close watch on incoming macro catalysts and price action around the 20-day SMA for early signs of a possible turnaround.

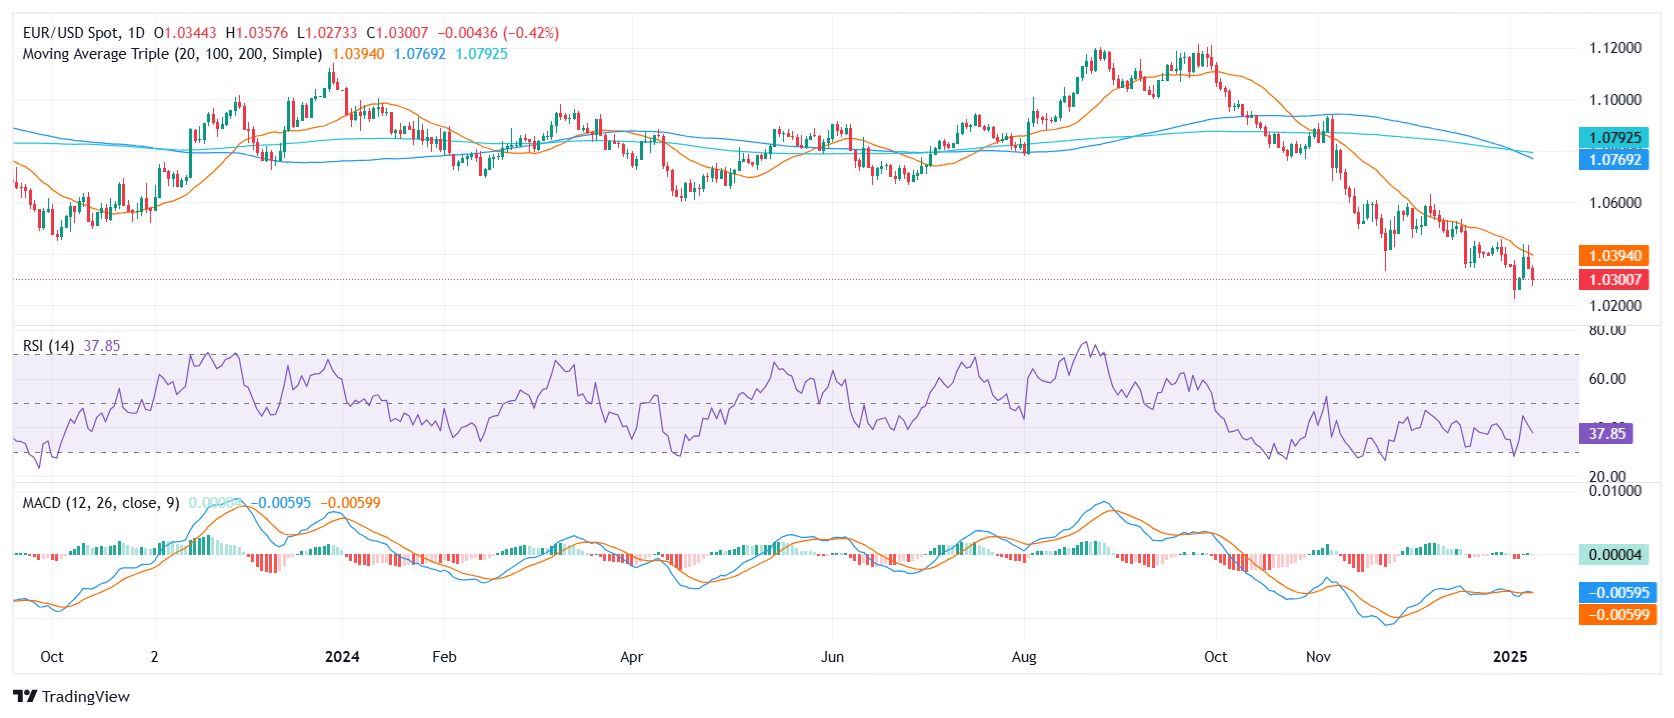
EUR/USD daily chart

United States EIA Crude Oil Stocks Change below forecasts (-0.25M) in January 3: Actual (-0.959M)

United States EIA Crude Oil Stocks Change below forecasts (-0.25M) in January 3: Actual (-0.959M)
Đọc thêm Previous

United States EIA Natural Gas Storage Change below forecasts (-39B) in January 3: Actual (-40B)

United States EIA Natural Gas Storage Change below forecasts (-39B) in January 3: Actual (-40B)
Đọc thêm Next