Back
12 Feb 2019
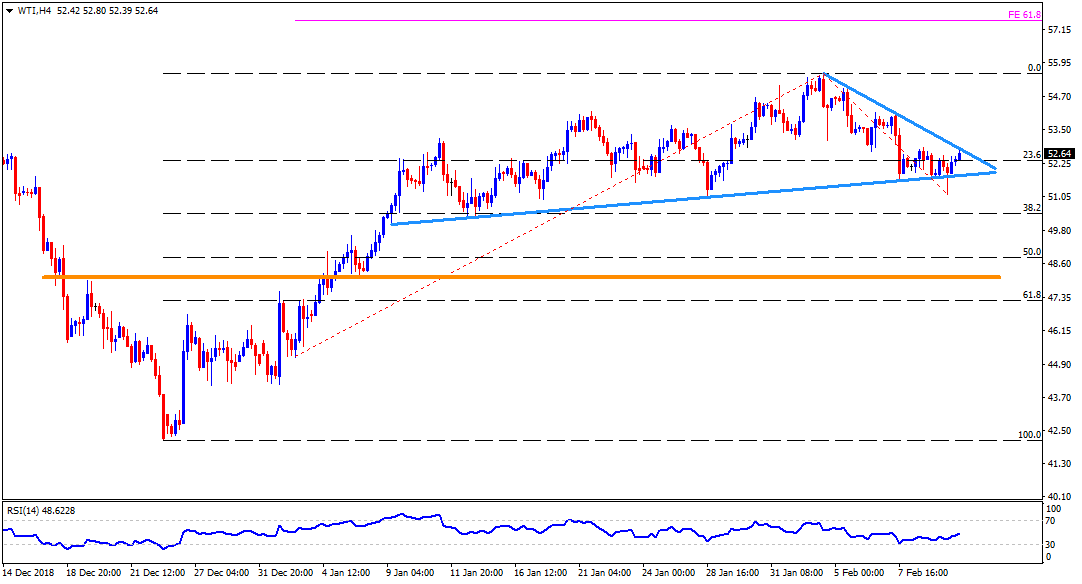
WTI Technical Analysis: $52.80 keeps challenging buyers
- WTI escalated prior gains to the intraday high of $52.80 before European markets open on Tuesday.
- The energy benchmark struggles around a weeklong downward sloping trend-line, at $52.80, in order to justify its strength.
- Should prices successfully clear $52.80 resistance-line, $54.20 and $54.90 may offer intermediate halts during rise to the current month high of $55.55.
- During the quote’s extended rally beyond $55.55, 61.8% Fibonacci Retracement of its latest up-moves, at $57.50, could flash on buyers’ radar.
- If at all the aforementioned trend-line continues to limit the upside attempts, an upward sloping support-line, at $51.80, may regain sellers’ attention.
- Moreover, quote’s declines past $51.80 might not hesitate to visit $51.00 and the $50.30 ahead of diverting markets to $50.00 round figure.
WTI 4-Hour chart
Additional important levels:
Overview:
Today Last Price: 53.1
Today Daily change: 35 pips
Today Daily change %: 0.66%
Today Daily Open: 52.75
Trends:
Daily SMA20: 53.47
Daily SMA50: 51.03
Daily SMA100: 56.65
Daily SMA200: 63.08
Levels:
Previous Daily High: 53.07
Previous Daily Low: 51.56
Previous Weekly High: 55.93
Previous Weekly Low: 52.05
Previous Monthly High: 55.48
Previous Monthly Low: 44.52
Daily Fibonacci 38.2%: 52.14
Daily Fibonacci 61.8%: 52.49
Daily Pivot Point S1: 51.85
Daily Pivot Point S2: 50.95
Daily Pivot Point S3: 50.34
Daily Pivot Point R1: 53.36
Daily Pivot Point R2: 53.97
Daily Pivot Point R3: 54.87