US Dollar Index off YTD peaks near 97.40 on data
- The index gathers extra pace to fresh 2019 highs near 97.40.
- Yields of the US 10-year note climb to tops around 2.68%.
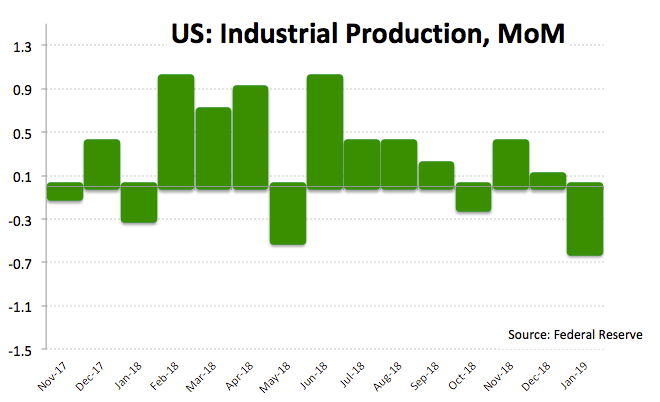
- Industrial Production contracted 0.6% MoM in January.
The greenback is now trading on a volatile fashion, coming down from fresh 2019 highs near the 97.40 region when tracked by the US Dollar Index (DXY) to the current 97.00 neighbourhood.
US Dollar Index spooked by data
Rising optimism stemming from the recent US-China trade talks in Beijing has been fuelling the solid up move in the buck via a stronger USD/JPY, as investors continue to favour riskier assets in detriment of safe havens.
Furthermore, yields of the key US 10-year reference have left behind the initial pessimism and are now moving to daily highs beyond the 2.68%.
In the US data universe, the Empire State manufacturing index came in above estimates in February at 8.80, also improving from January’s 3.90. Additionally, Industrial Production unexpectedly contracted 0.6% MoM during last month along with a downtick in Capacity Utilization to 78.2% during the same period.
Still in the US docket, February’s preliminary Consumer Sentiment figures are coming up next.
What to look for around USD
Market participants have considered as positive the recent developments from the US-China negotiations in Beijing ahead of further talks next week in Washington, pushing yields and the index higher (via USD/JPY). In the meantime, investors remain vigilant on upcoming results on US fundamentals, as they continue to assess the probability of a deceleration in the US economy in the next months. On the broader picture, the slowdown in overseas economies in combination with ‘softer’ stance in G10 central banks keeps occasional dips in the buck somewhat shallow. This view is reinforced by rising scepticism over a potential halt in the Fed’s tightening cycle this year.
US Dollar Index relevant levels
At the moment, the pair is advancing 0.05% at 97.06 facing the next hurdle at 97.37 (2019 high Feb.15) followed by 97.71 (2018 high Dec.14) and then 97.87 (monthly high Jun.20 2017). On the other hand, a break below 96.79 (23.6% Fibo of the September-December up move) would open the door to 96.65 (10-day SMA) and finally 96.42 (55-day SMA).