GBP/JPY Technical Analysis: Sterling breaks above 142.00 figure against JPY
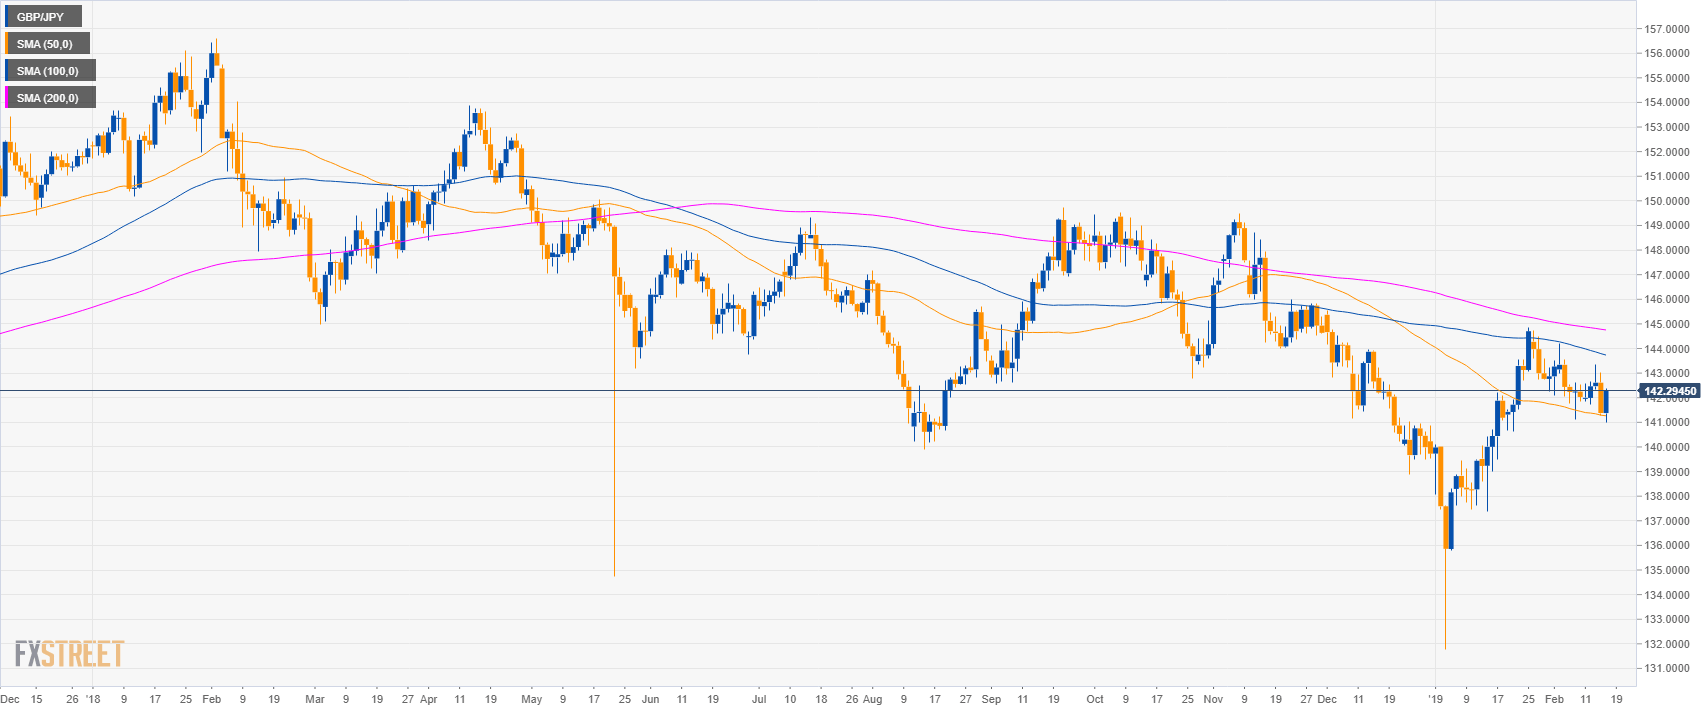
GBP/JPY daily chart
- GBP/JPY is trading between the 50 and 200-day simple moving averages (SMAs) suggesting a sideways market.
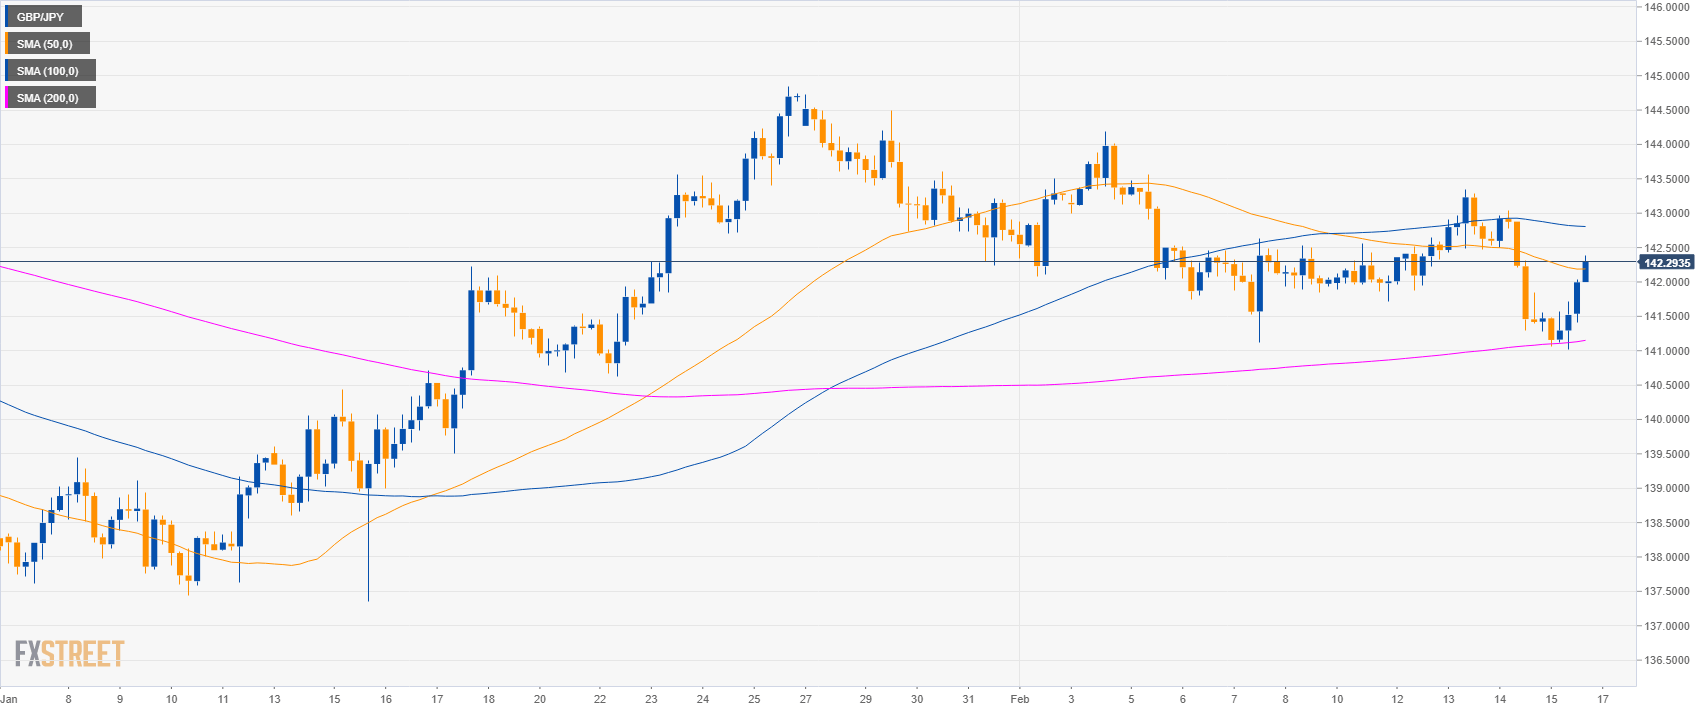
GBP/JPY 4-hour chart
- GBP/JPY is trading between the 100 and 200 SMA on the 4-hour chart suggesting a sideways market in the medium-term.
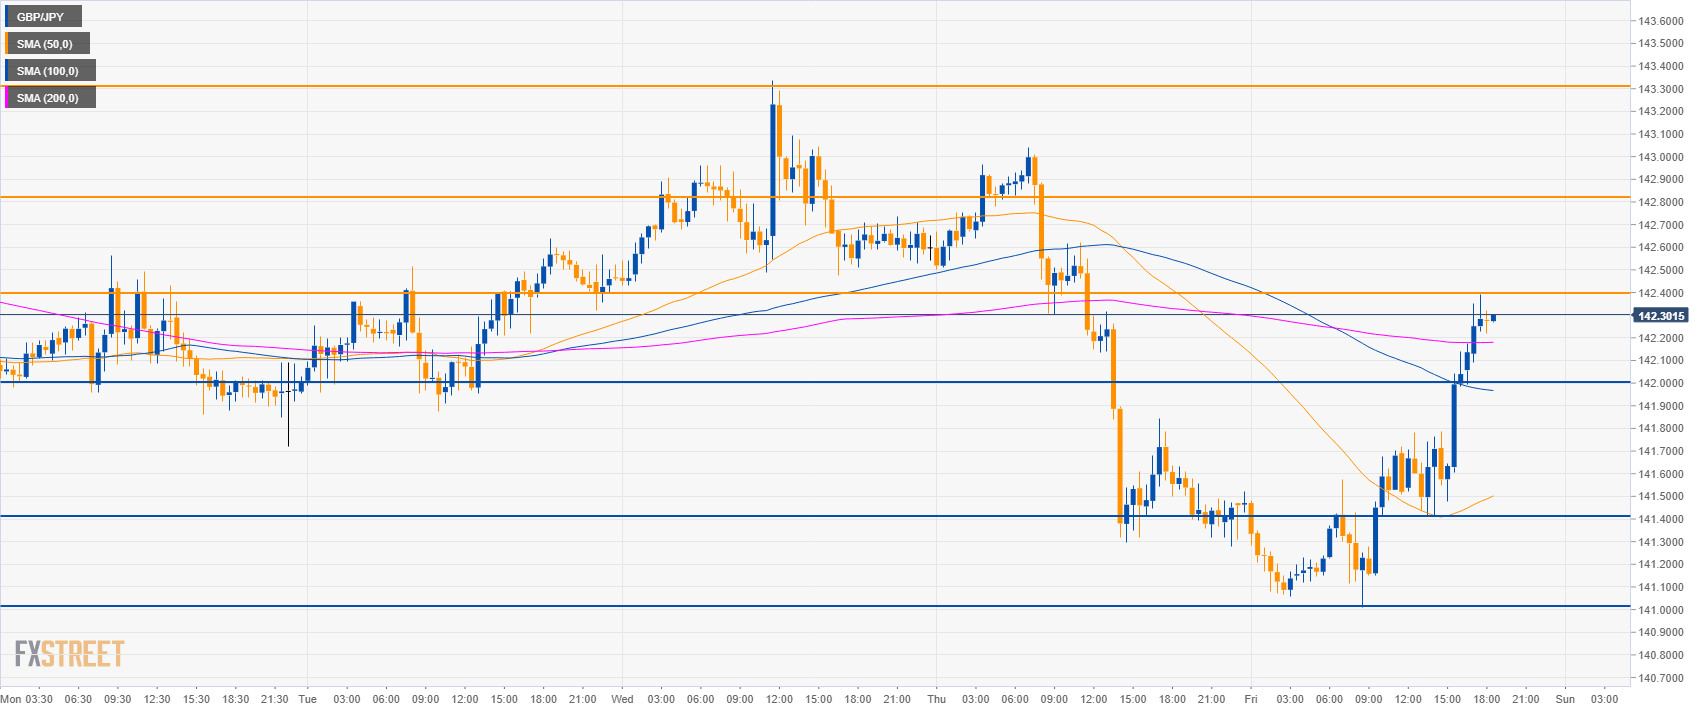
GBP/JPY 30-minute chart
- GBP/JPY is trading above its main SMAs suggesting bullish momentum.
- The level to beat for bulls is 142.40. Resistances to the upside are seen near 142.80 and 143.30.
- Supports are seen, near 142.00 and 141.40 level.
Additional key levels
GBP/JPY
Overview:
Today Last Price: 142.27
Today Daily change: 89 pips
Today Daily change %: 0.63%
Today Daily Open: 141.38
Trends:
Daily SMA20: 142.6
Daily SMA50: 141.29
Daily SMA100: 143.8
Daily SMA200: 144.79
Levels:
Previous Daily High: 143.04
Previous Daily Low: 141.3
Previous Weekly High: 144.18
Previous Weekly Low: 141.12
Previous Monthly High: 144.85
Previous Monthly Low: 131.79
Daily Fibonacci 38.2%: 141.96
Daily Fibonacci 61.8%: 142.37
Daily Pivot Point S1: 140.77
Daily Pivot Point S2: 140.16
Daily Pivot Point S3: 139.03
Daily Pivot Point R1: 142.51
Daily Pivot Point R2: 143.65
Daily Pivot Point R3: 144.26