Oil Technical Analysis: WTI jumps above $57.00 a barrel
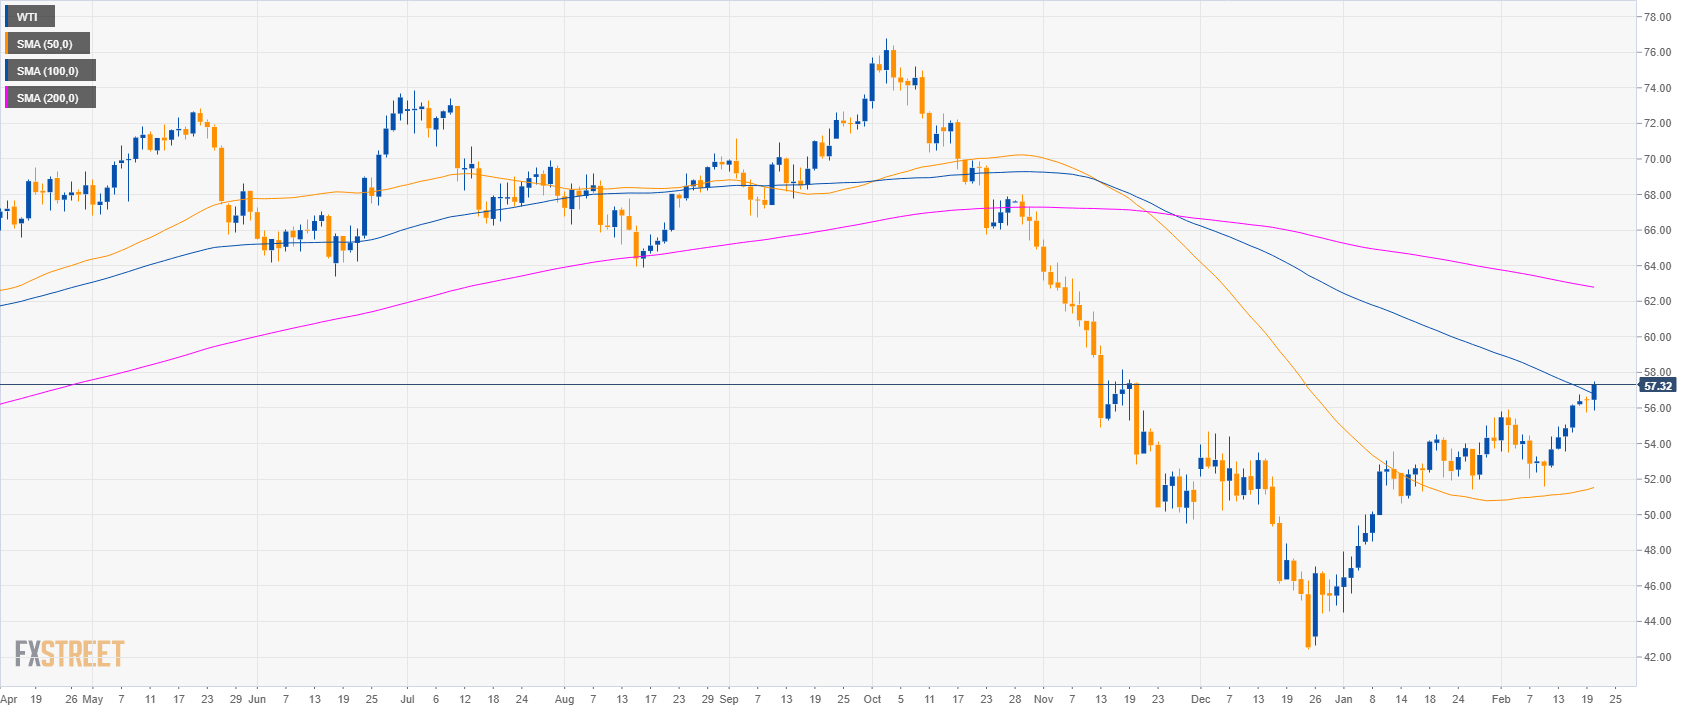
Oil daily chart
- Crude oil WTI is breaking above the 100 SMA suggesting that bulls are getting stronger.
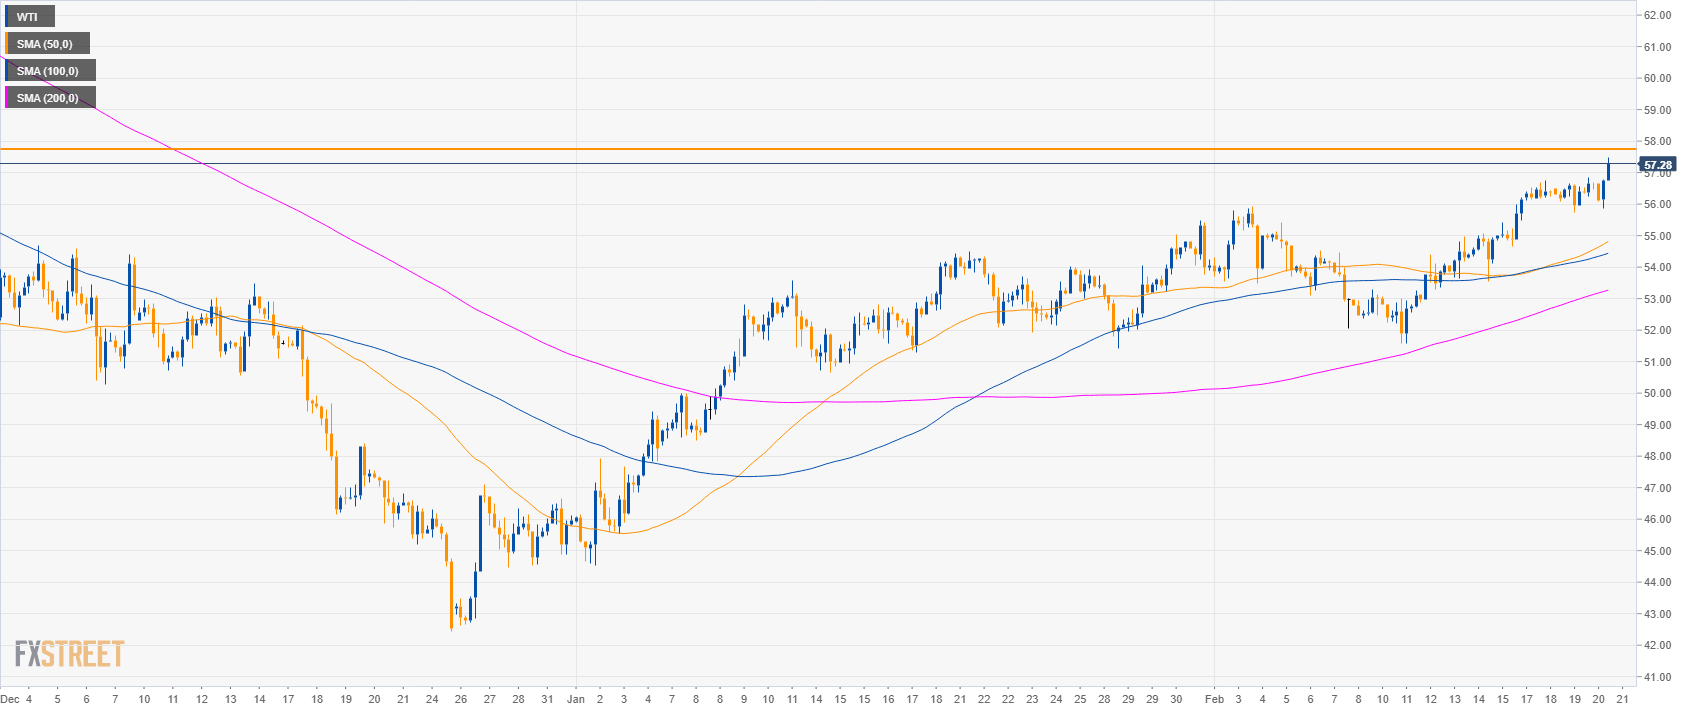
Oil 4-hour chart
- Crude oil is trading above the main SMAs suggesting bullish momentum in the medium-term.
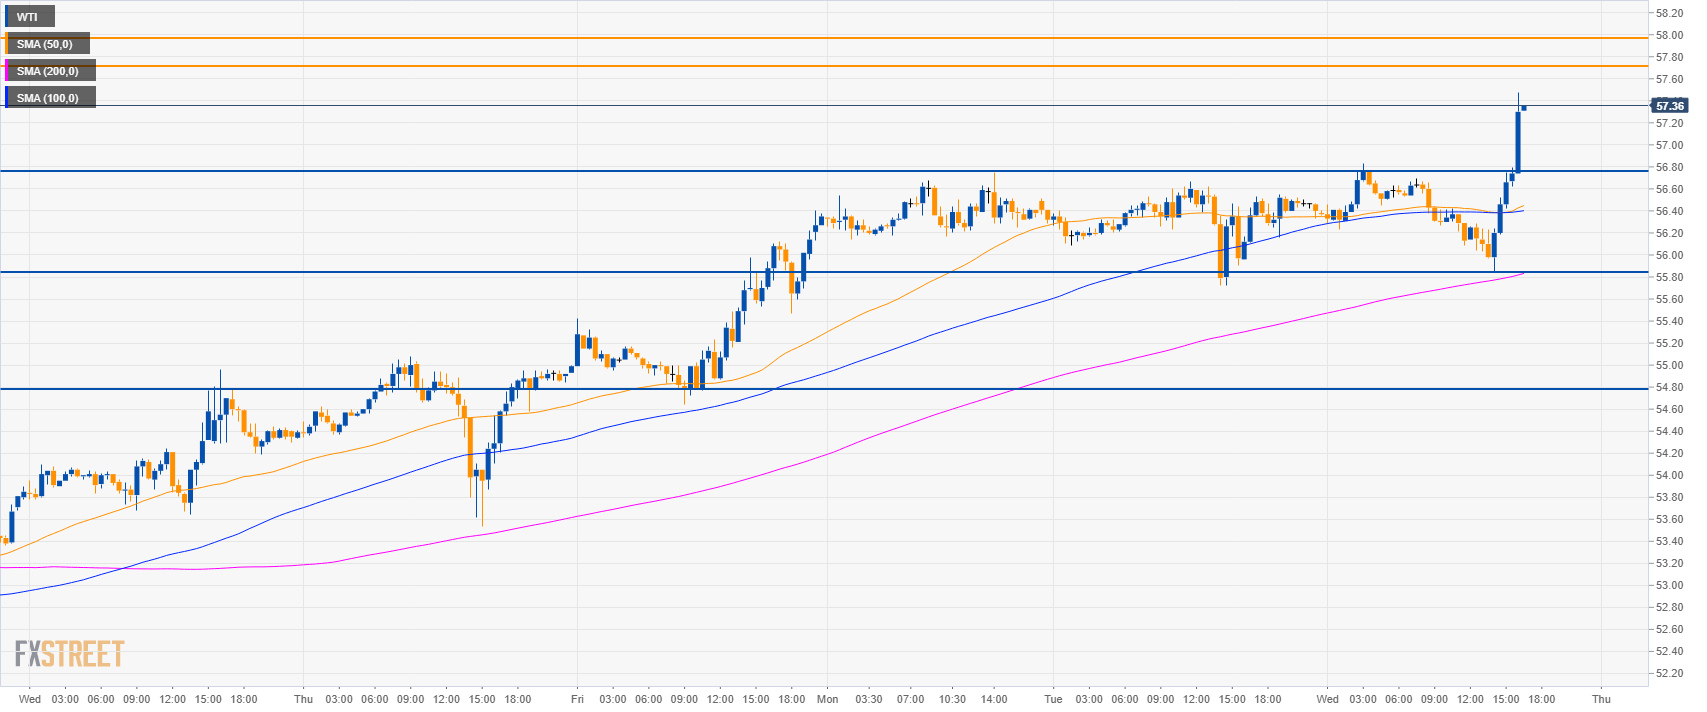
Oil 30-minute chart
- WTI is trading above its main SMAs suggesting bullish momentum in the short-term.
- The next bullish target is at 57.70 and $58.00 a barrel.
- Support is seen at 56.80 and 55.80 level.
Additional key levels
WTI
Overview:
Today Last Price: 57.3
Today Daily change: 83 ticks
Today Daily change %: 1.47%
Today Daily Open: 56.47
Trends:
Daily SMA20: 54.13
Daily SMA50: 51.42
Daily SMA100: 55.59
Daily SMA200: 62.77
Levels:
Previous Daily High: 56.67
Previous Daily Low: 55.72
Previous Weekly High: 56.22
Previous Weekly Low: 51.56
Previous Monthly High: 55.48
Previous Monthly Low: 44.52
Daily Fibonacci 38.2%: 56.08
Daily Fibonacci 61.8%: 56.31
Daily Pivot Point S1: 55.9
Daily Pivot Point S2: 55.34
Daily Pivot Point S3: 54.95
Daily Pivot Point R1: 56.85
Daily Pivot Point R2: 57.24
Daily Pivot Point R3: 57.8