USD/JPY Technical Analysis: Greenback holding on above 110.80 level
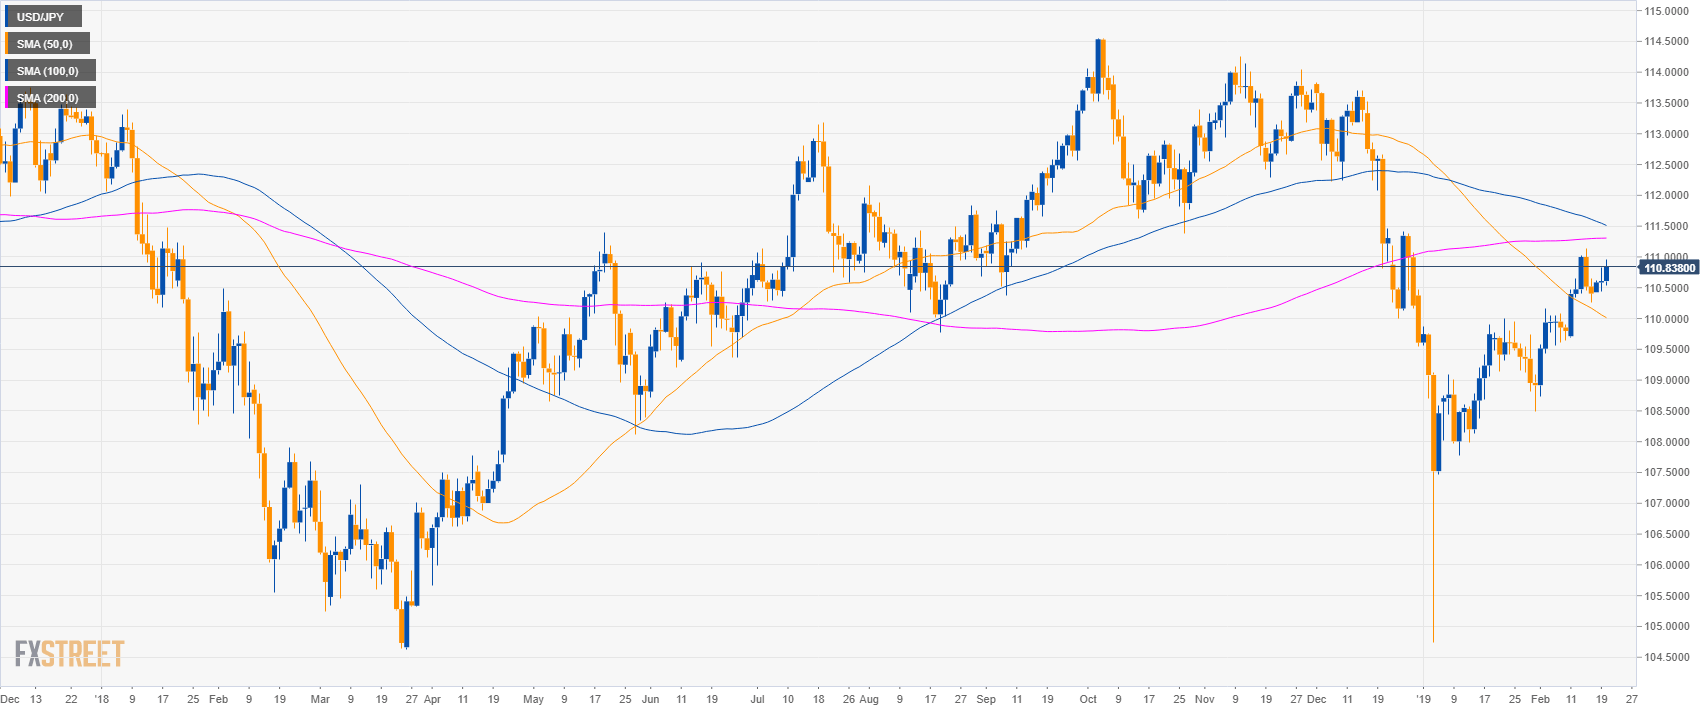
USD/JPY daily chart
- USD/JPY is trading in a deep pullback below the 200-day simple moving averages (SMAs) on the daily chart.
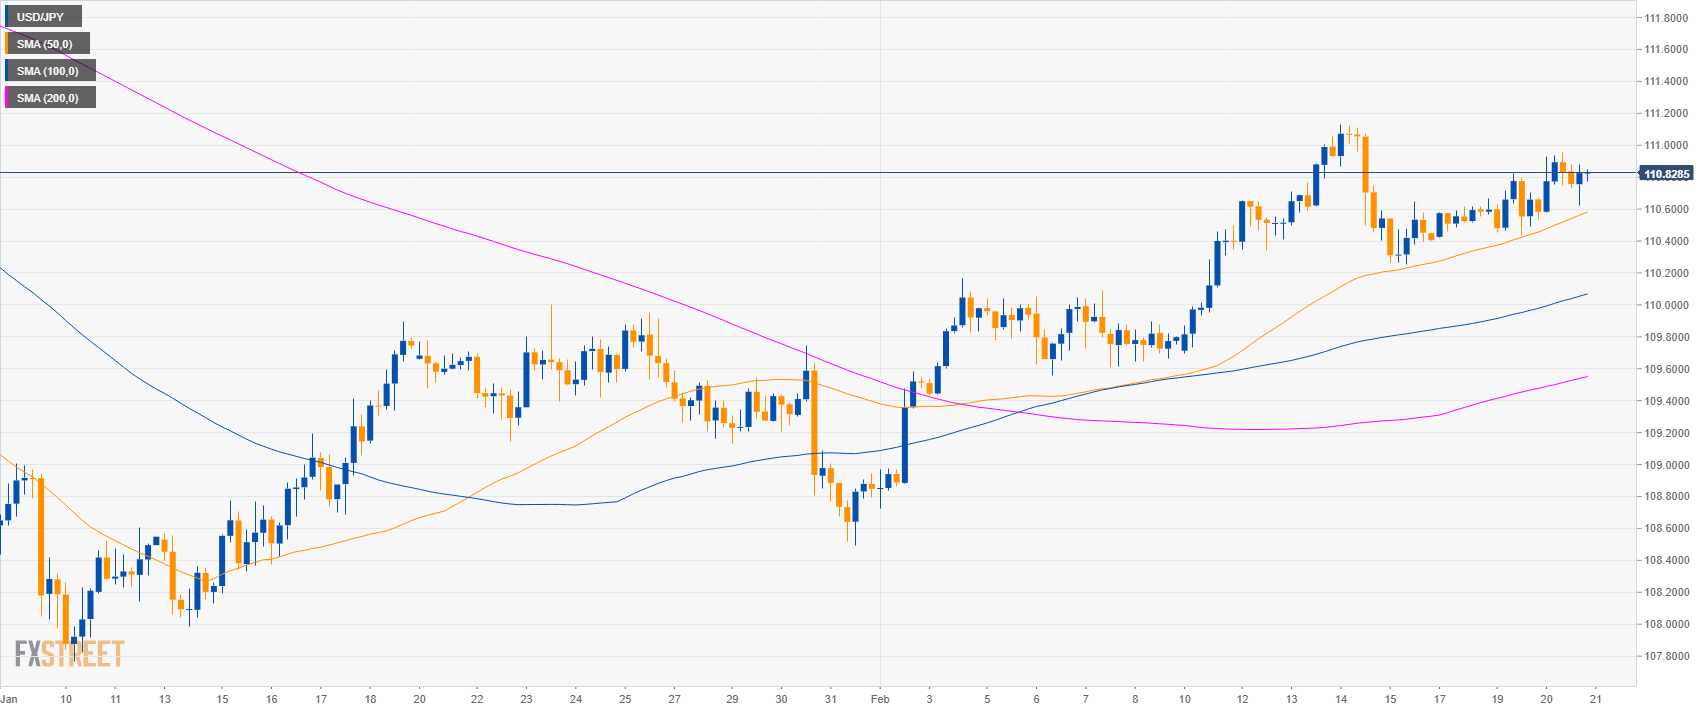
USD/JPY 4-hour chart
- USD/JPY is trading above its main SMAs suggesting bullish momentum in the medium-term.
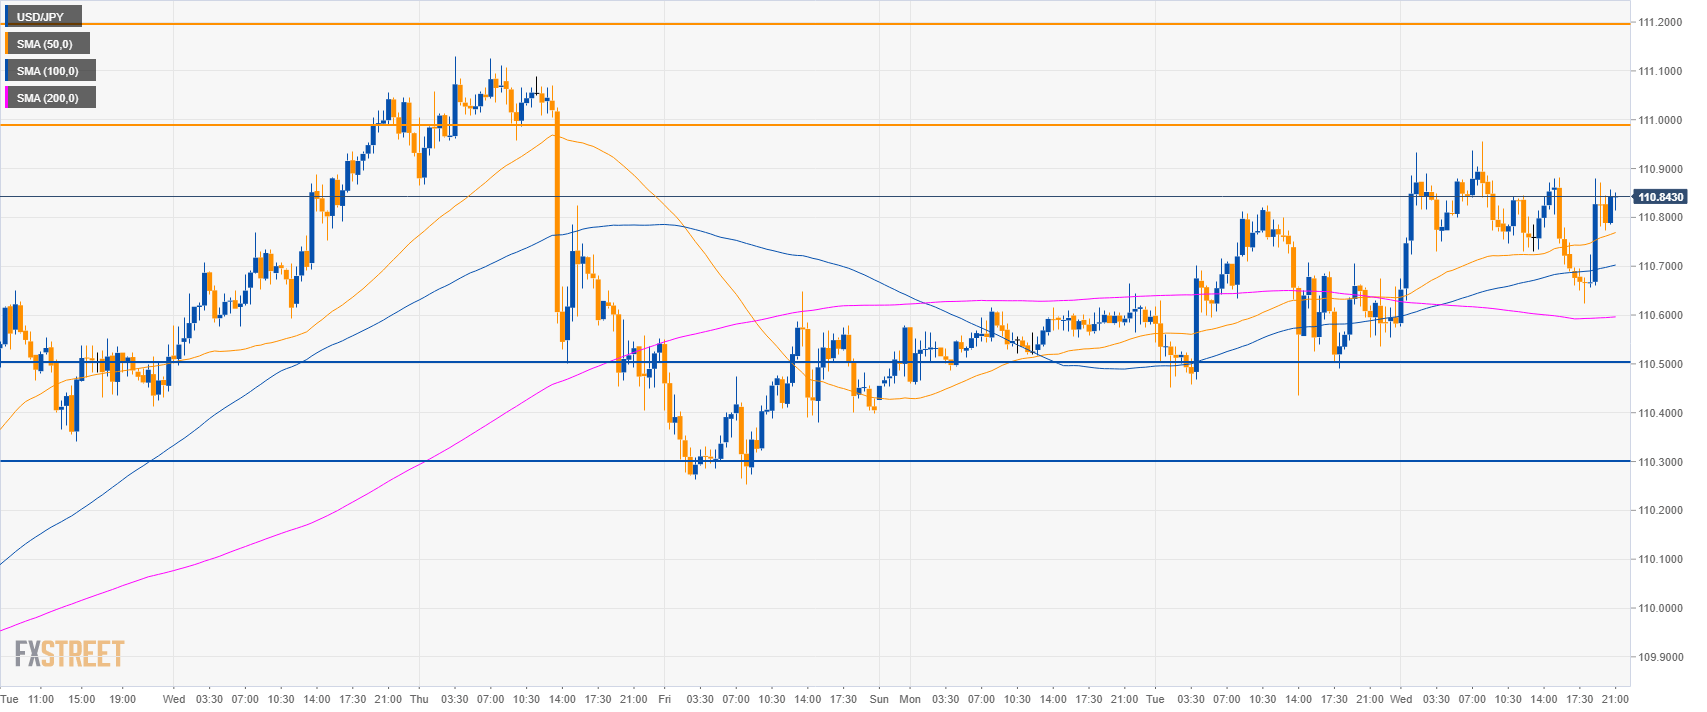
USD/JPY 30-minute chart
- USD/JPY is trading above the main SMAs suggesting bullish momentum in the short-term.
- Bulls might try to reach 111.00 and 111.20 level.
- Supports to the downside are seen at 110.50 and 110.30 level.
Additional key levels
USD/JPY
Overview:
Today Last Price: 110.84
Today Daily change: 23 pips
Today Daily change %: 0.21%
Today Daily Open: 110.61
Trends:
Daily SMA20: 109.92
Daily SMA50: 110.06
Daily SMA100: 111.55
Daily SMA200: 111.31
Levels:
Previous Daily High: 110.82
Previous Daily Low: 110.44
Previous Weekly High: 111.13
Previous Weekly Low: 109.7
Previous Monthly High: 110
Previous Monthly Low: 104.75
Daily Fibonacci 38.2%: 110.68
Daily Fibonacci 61.8%: 110.58
Daily Pivot Point S1: 110.42
Daily Pivot Point S2: 110.23
Daily Pivot Point S3: 110.03
Daily Pivot Point R1: 110.81
Daily Pivot Point R2: 111.01
Daily Pivot Point R3: 111.2