Back


11 Sep 2019
USD/JPY technical analysis: Greenback clings to weekly highs near 107.90 level
- USD/JPY holds onto weekly gains as the market is nearing the 107.90 resistance.
- The levels to beat for bulls is the 107.90/108.13 resistance zone.
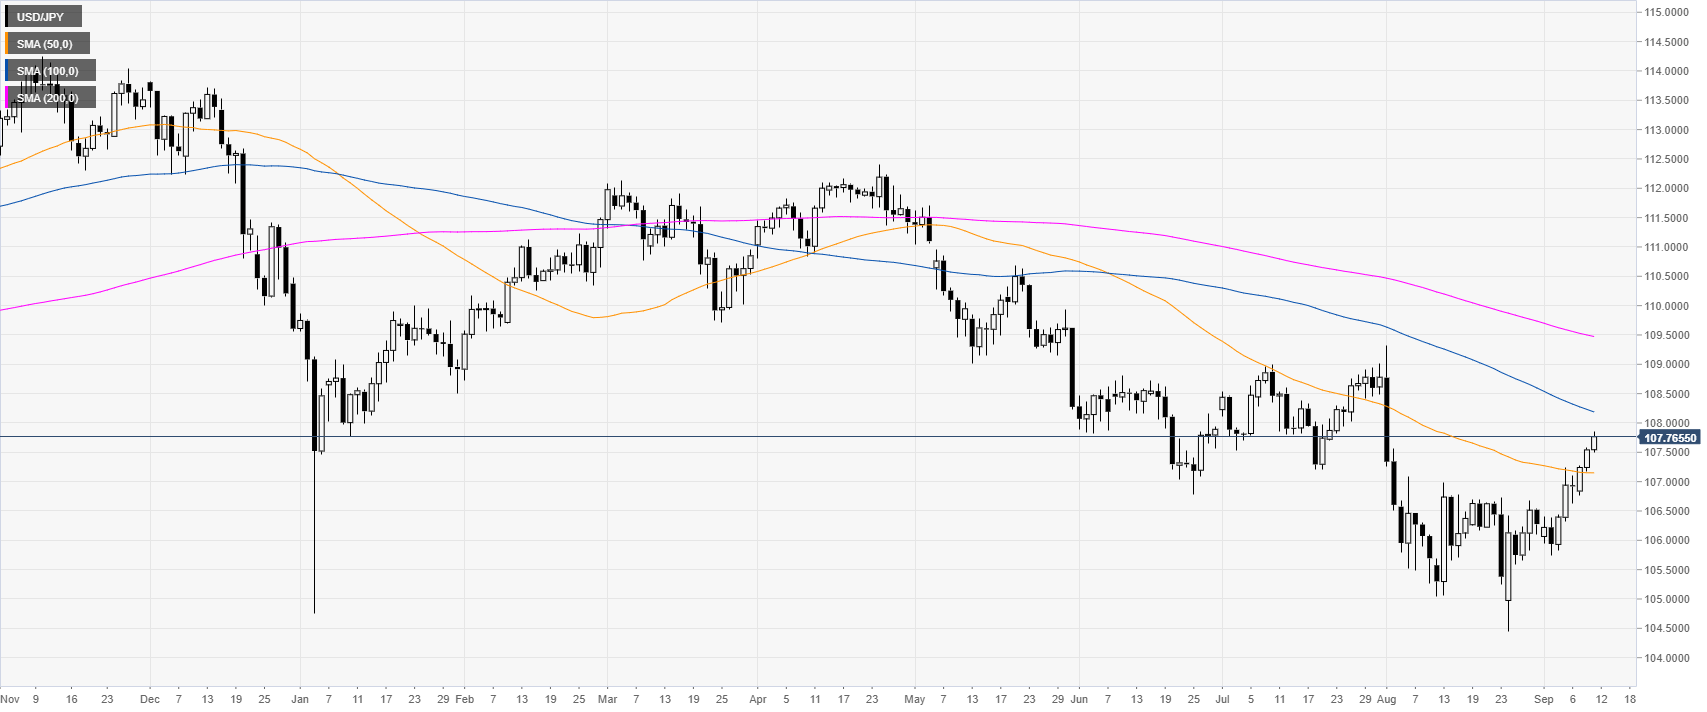
USD/JPY daily chart
USD/JPY is trading in a bear trend below the 100 and 200-day simple moving averages (DSMAs). The market broke above the 107.00 figure and the 50 SMA.

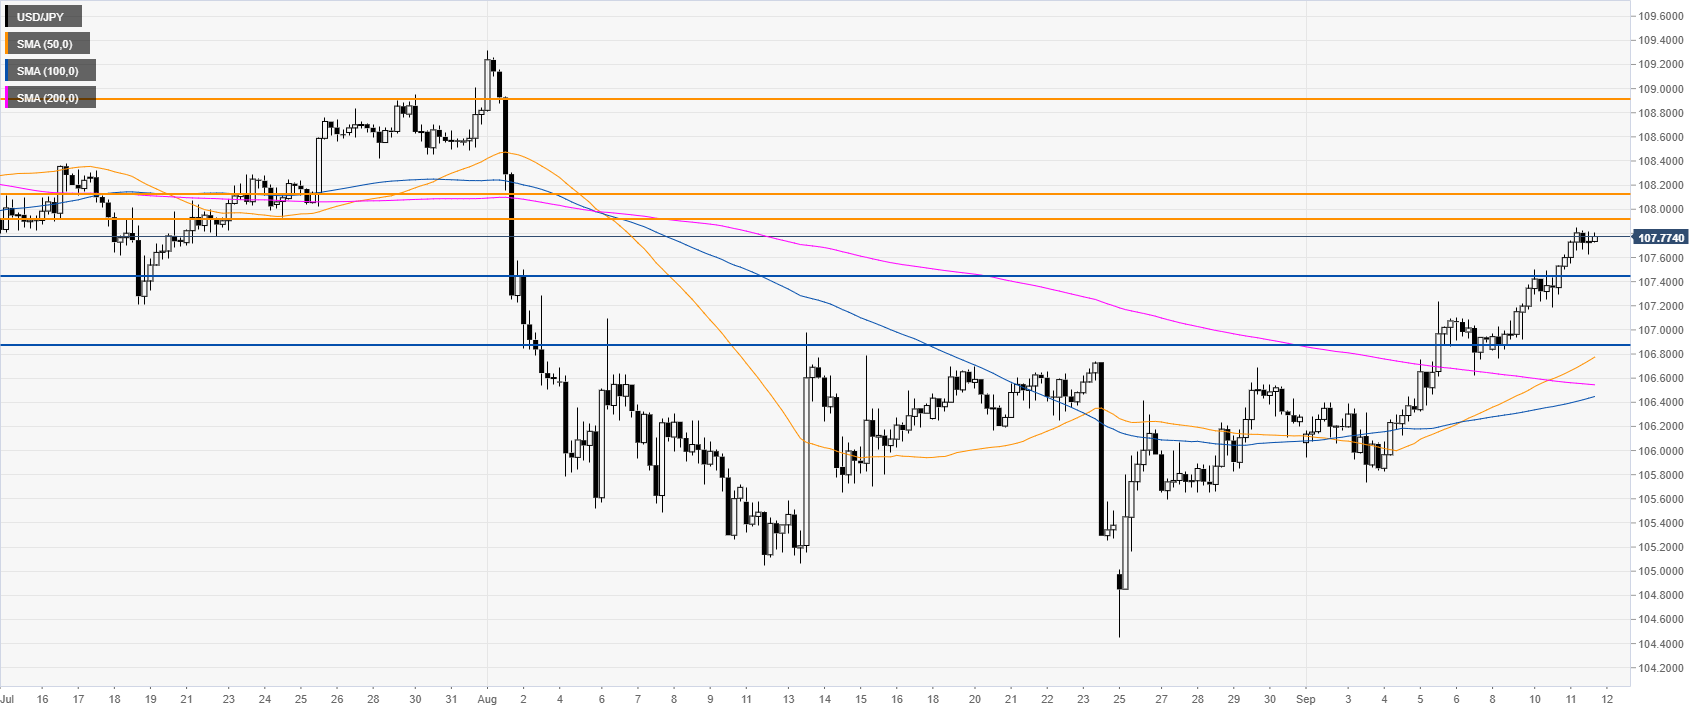
USD/JPY 4-hour chart
USD/JPY is trading above its main SMAs, suggesting bullish momentum in the medium term. Bulls will be looking for a break beyond the 107.90/108.13 resistance zone in order to set their eyes on the 108.92 resistance level, according to the Technical Confluences Indicator.

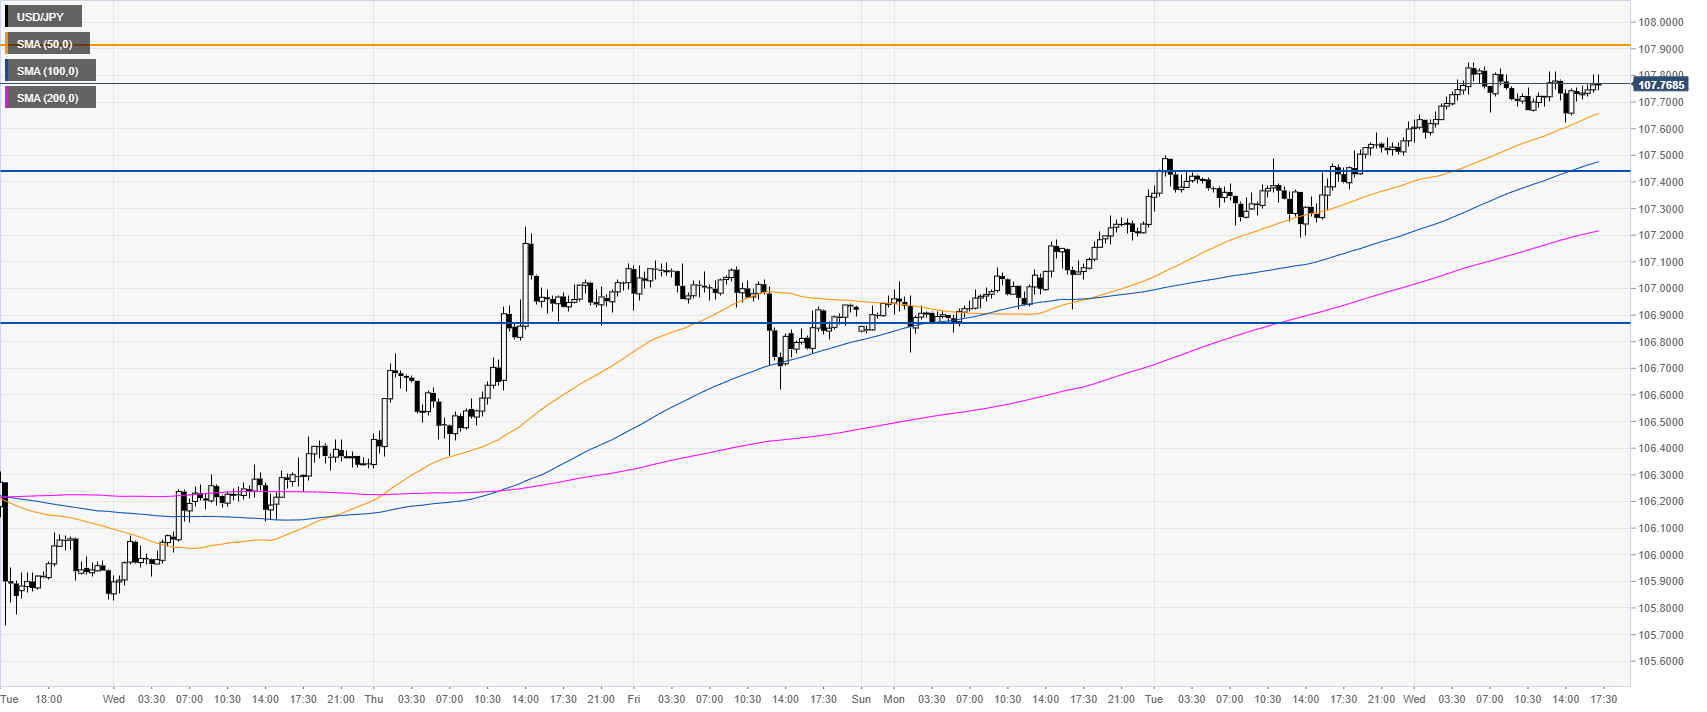
USD/JPY 30-minute chart
Dollar/Yen is trading above the main SMAs, suggesting bullish momentum in the near term. Immediate support is seen at 107.42 level followed by the 106.90 level, according to the Technical Confluences Indicator.

Additional key levels
