USD/INR technical analysis: 100/200-bar SMA confluence restricts latest recovery
- USD/INR stays around week’s high following its recovery from monthly bottom.
- Six-week-old falling trend line adds to the upside barriers.
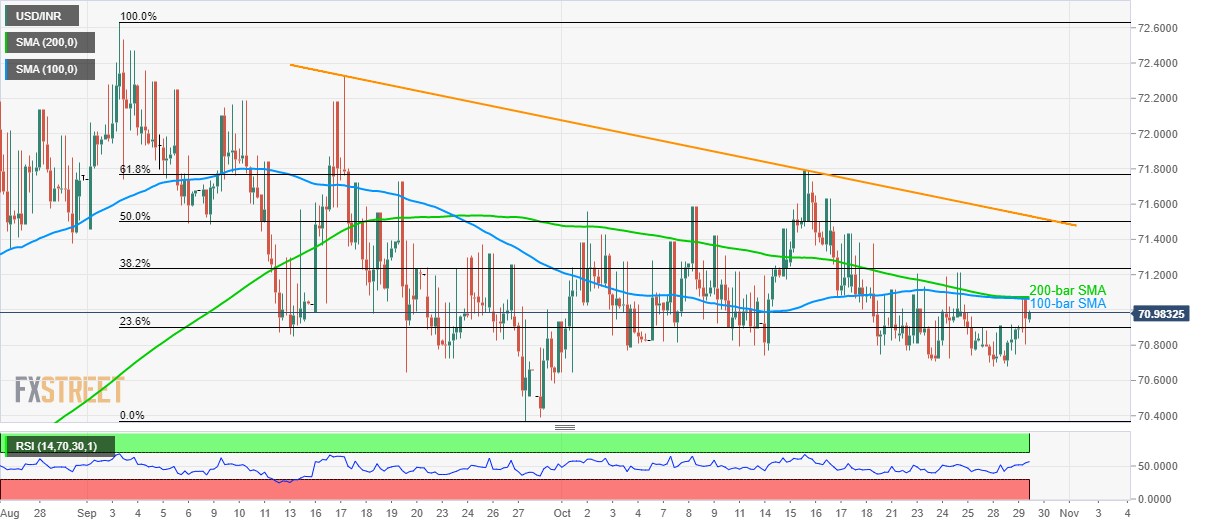
Despite bouncing off monthly lows during the previous day, USD/INR is still trading below key near-term SMA confluence while taking rounds to 71.00 ahead of the European session on Wednesday.
The pair needs a sustained break above 71.06/10 to escalate recent pullback towards 71.50/55 area comprising 50% Fibonacci retracement of September month declines and a descending resistance line since September 17.
Additionally, 61.8% Fibonacci retracement of 71.80 and 72.00 could challenge buyers past-71.55.
On the flip side, 70.90 level including 23.6% Fibonacci retracement becomes an immediate support ahead of the monthly bottom around 70.70.
Its worth noting that September month low surrounding 70.35 and 70.00 could entertain bears ahead of pleasing them with 69.80 rest-point.
USD/INR 4-hour chart
Trend: pullback expected