Back
30 Oct 2019
GBP/USD technical analysis: Cable trading below 1.2900 figure ahead of Fed’s decision
- GBP/USD is trading mixed ahead of the Fed’s decision at 18:00 GMT.
- The current bullish momentum is doubtful, decreasing the possibilities of a breakout above the 1.2900 handle.
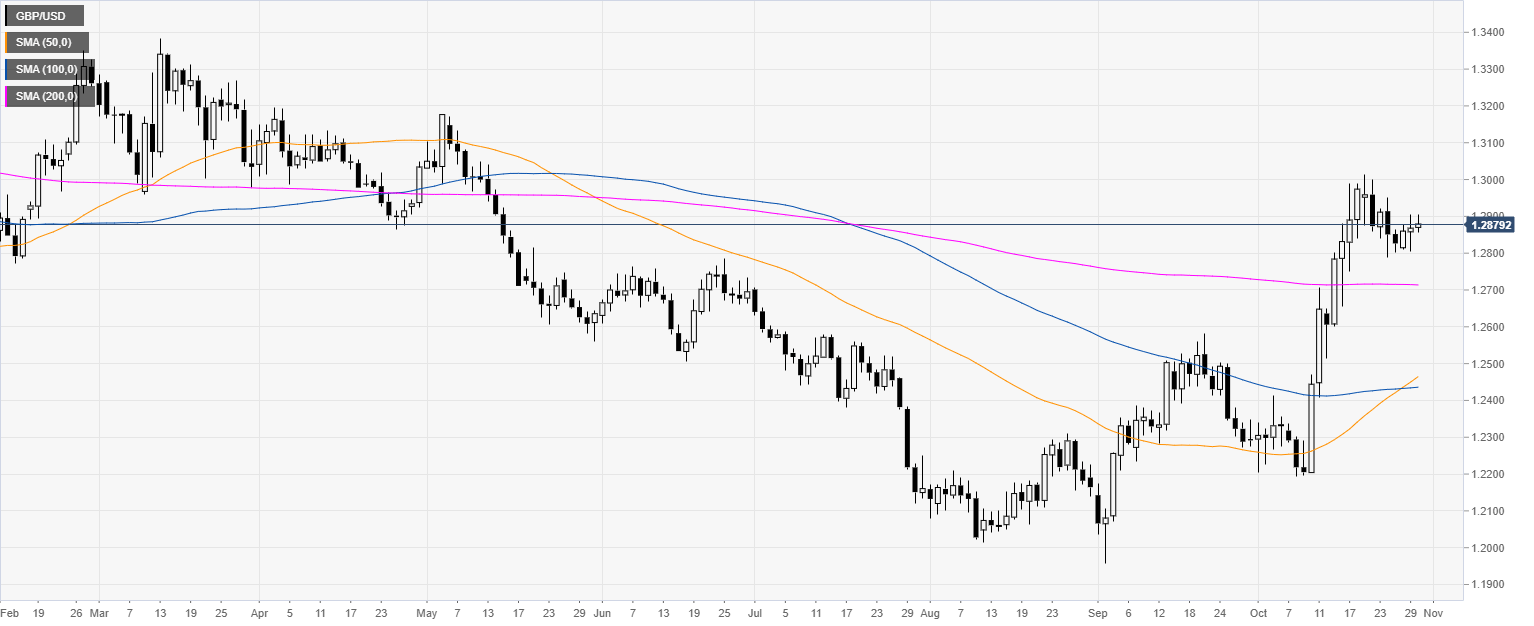
GBP/USD daily chart
In October, the cable had a dramatic boost above its main daily simple moving averages (DMAs) and hit levels not seen since mid-May 2019. The market is likely waiting for the Fed’s rate decision at 18:00 GMT.
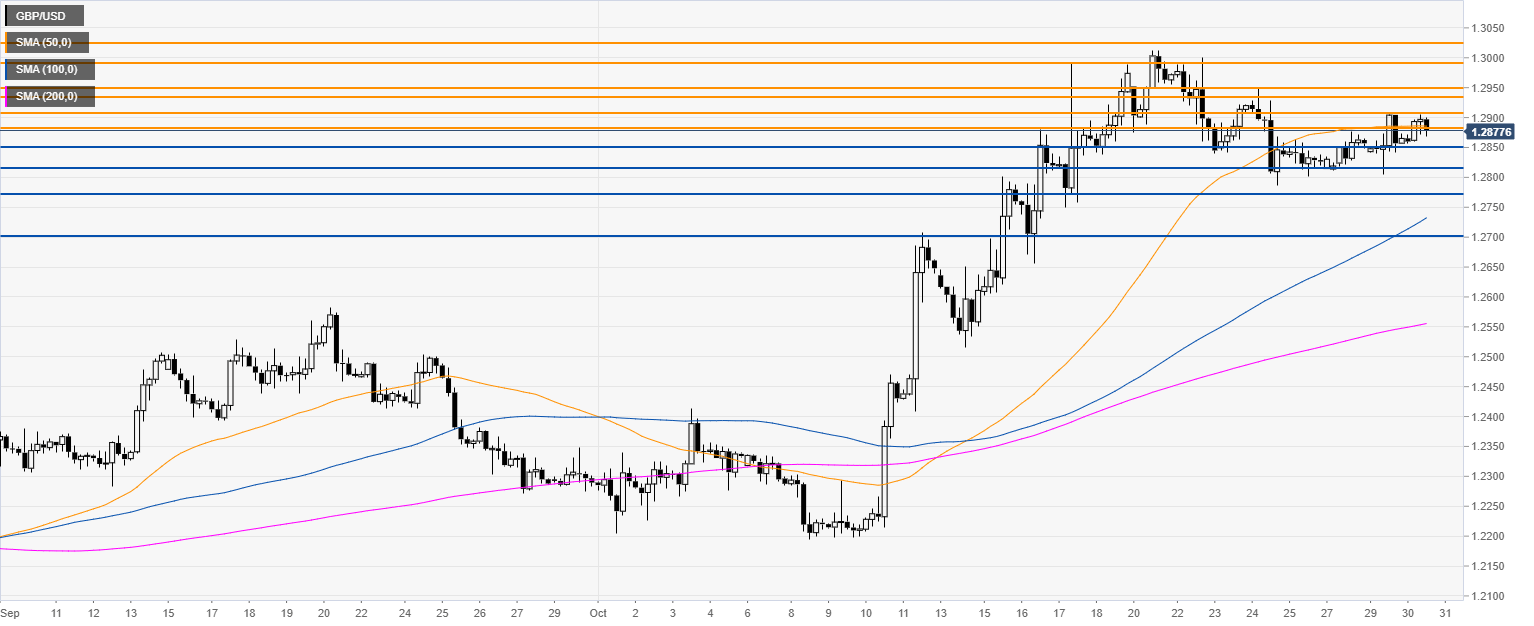
GBP/USD four-hour chart
GBP/USD is sidelined below both the 1.2900 figure and the 50 SMA. One more time, the spot is failing to breach the 1.2909 resistance near the 50 SMA. The market will need to break above that level for a retest of the 1.2950/1.3000 resistance zone, according to the Technical Confluences Indicator.
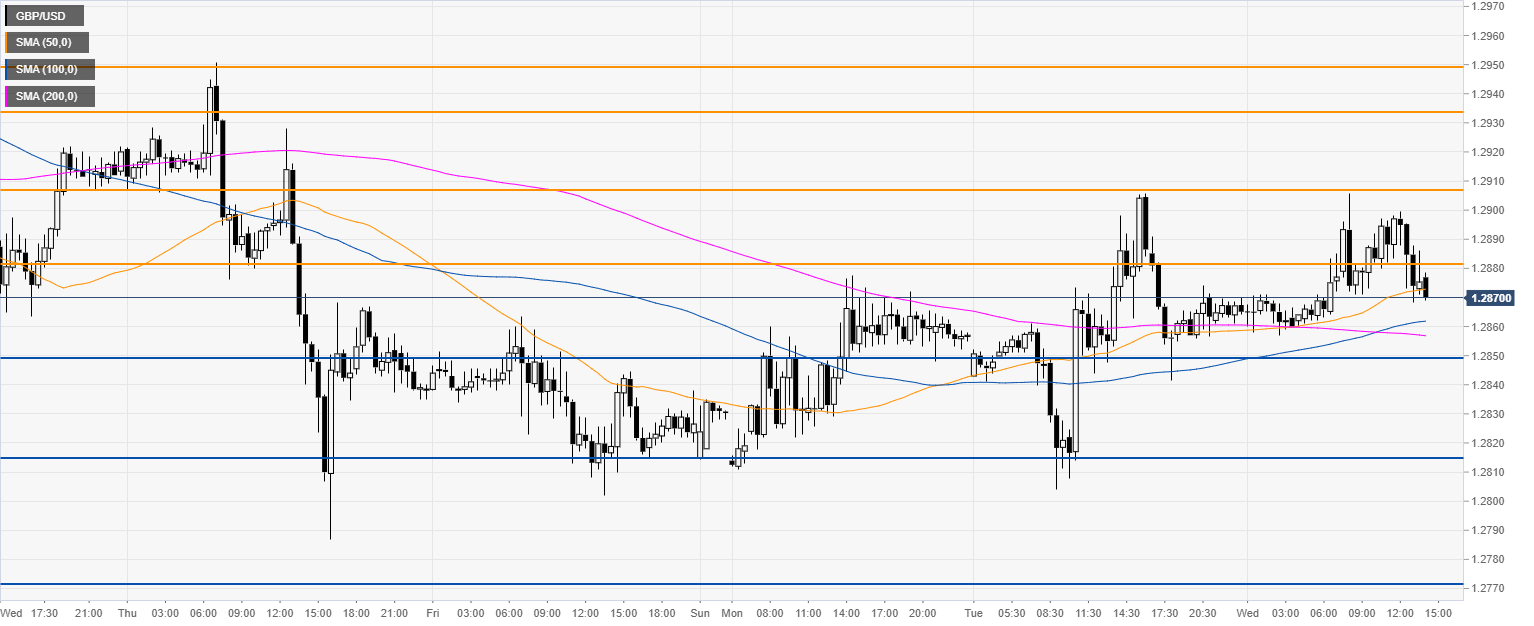
GBP/USD 30-minute chart
GBP/USD is trading above a flat 200 SMA, suggesting a questionable bullish bias in the near term. Support is seen at 1.2850 and 1.2815, according to the Technical Confluences Indicator.
Additional key levels