Back
6 Feb 2020
GBP/USD Price Analysis: Pound hits fresh 2020 lows, nearing 1.2900 figure
- GBP/USD is under heavy bearish in the lower end of its 2-month range.
- The level to beat for sellers is the 1.2938 support.
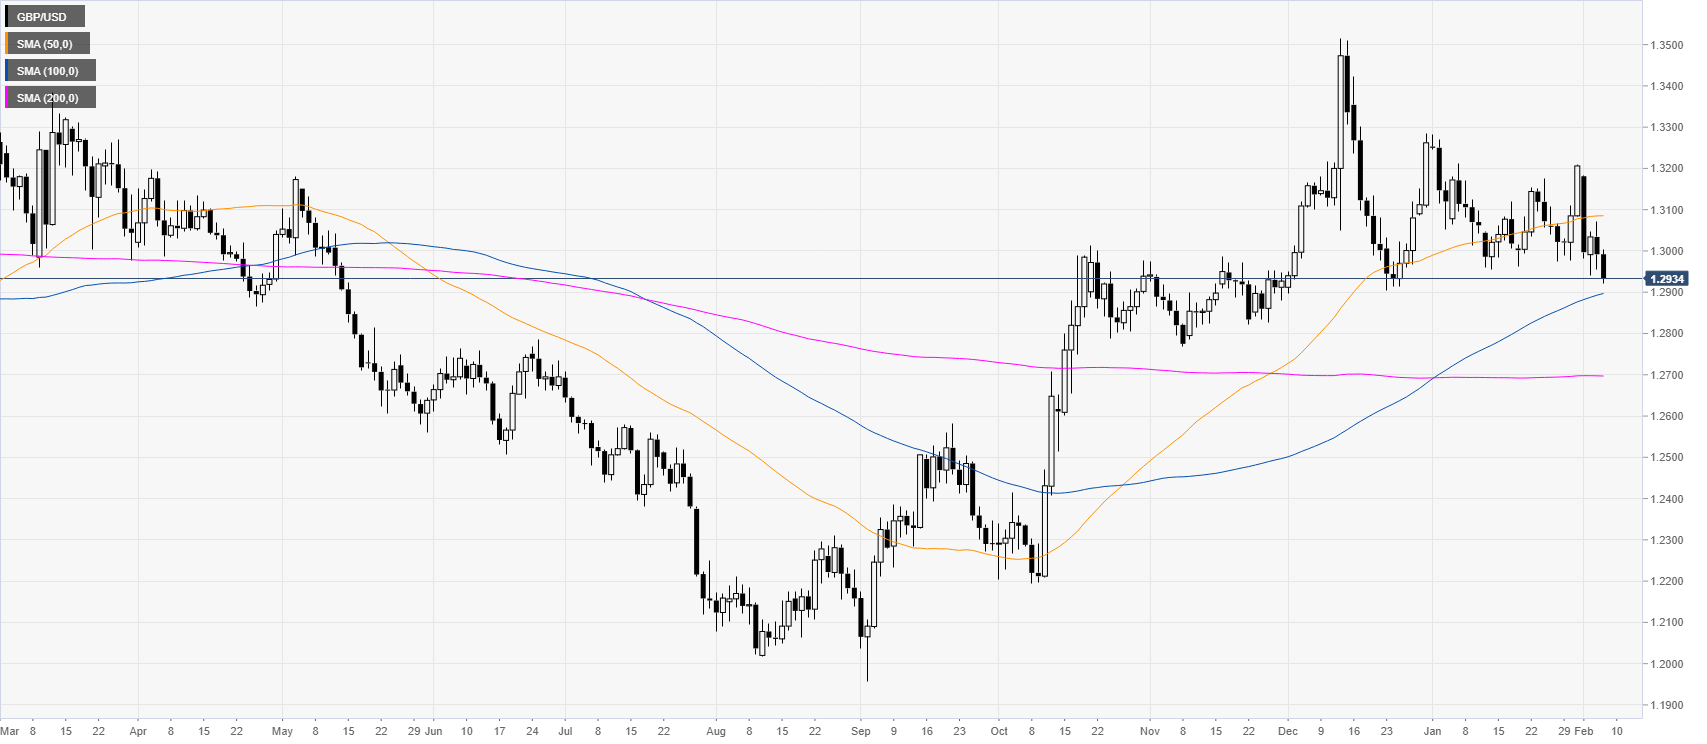
GBP/USD daily chart
After the October and December bullish markets, GBP/USD is trading in a rectangle consolidation above its 100/200-day simple moving averages (SMAs).
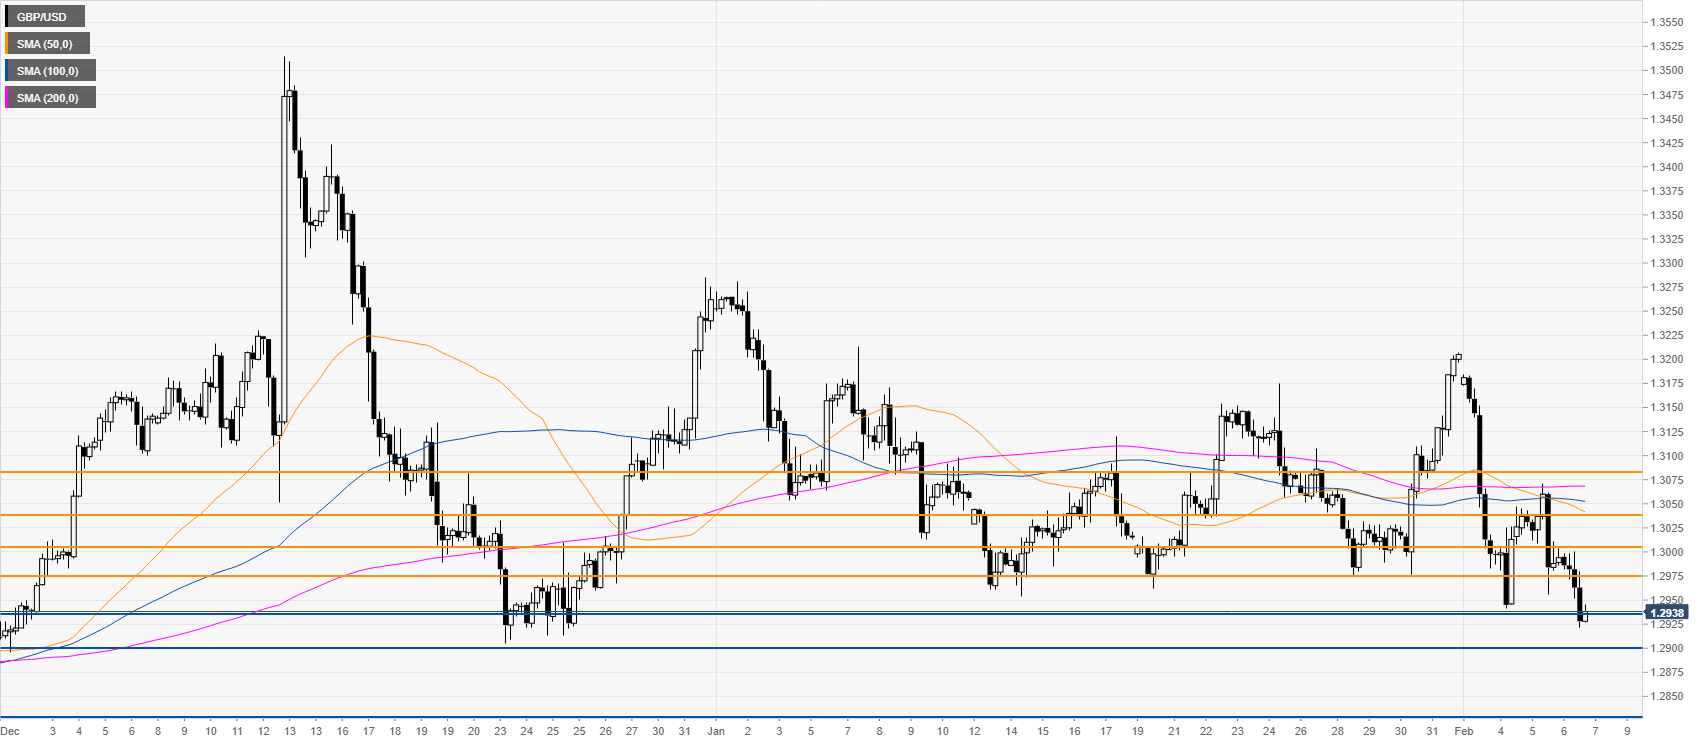
GBP/USD four-hour chart
GBP/USD is under heavy selling pressure as bears are attacking the 1.2938 support. A break below the above-mentioned level could lead to further weakness towards the 1.2900 figure and the 1.2829 level. Resistances are seen at the 1.2972 level and 1.3000 figure, according to the Technical Confluences Indicator.
Resistance: 1.2972, 1.3000, 1.3040
Support: 1.2938, 1.2900, 1.2829
Additional key levels