Back
13 Feb 2020
USD/JPY Asia Price Forecast: Greenback stabilizes below the 110.00 figure
- USD/JPY is challenging the 109.85 resistance.
- The rising wedge formation can limit the bullish pressure.
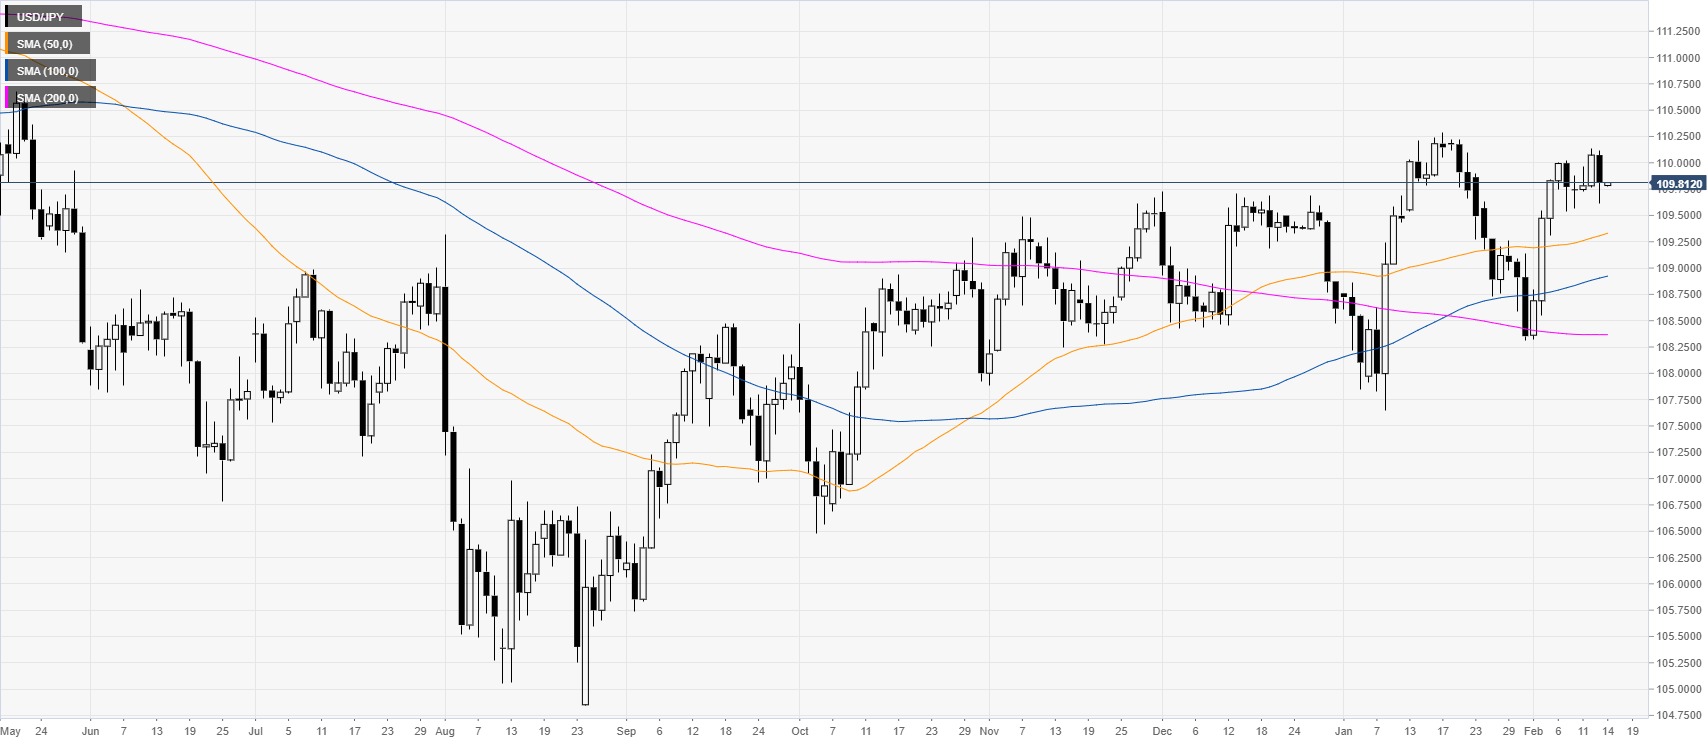
USD/JPY daily chart
USD/JPY eased below the 110.00 figure while trading above its main daily simple moving averages (SMAs). The spot is still hovering near the 2020 highs.
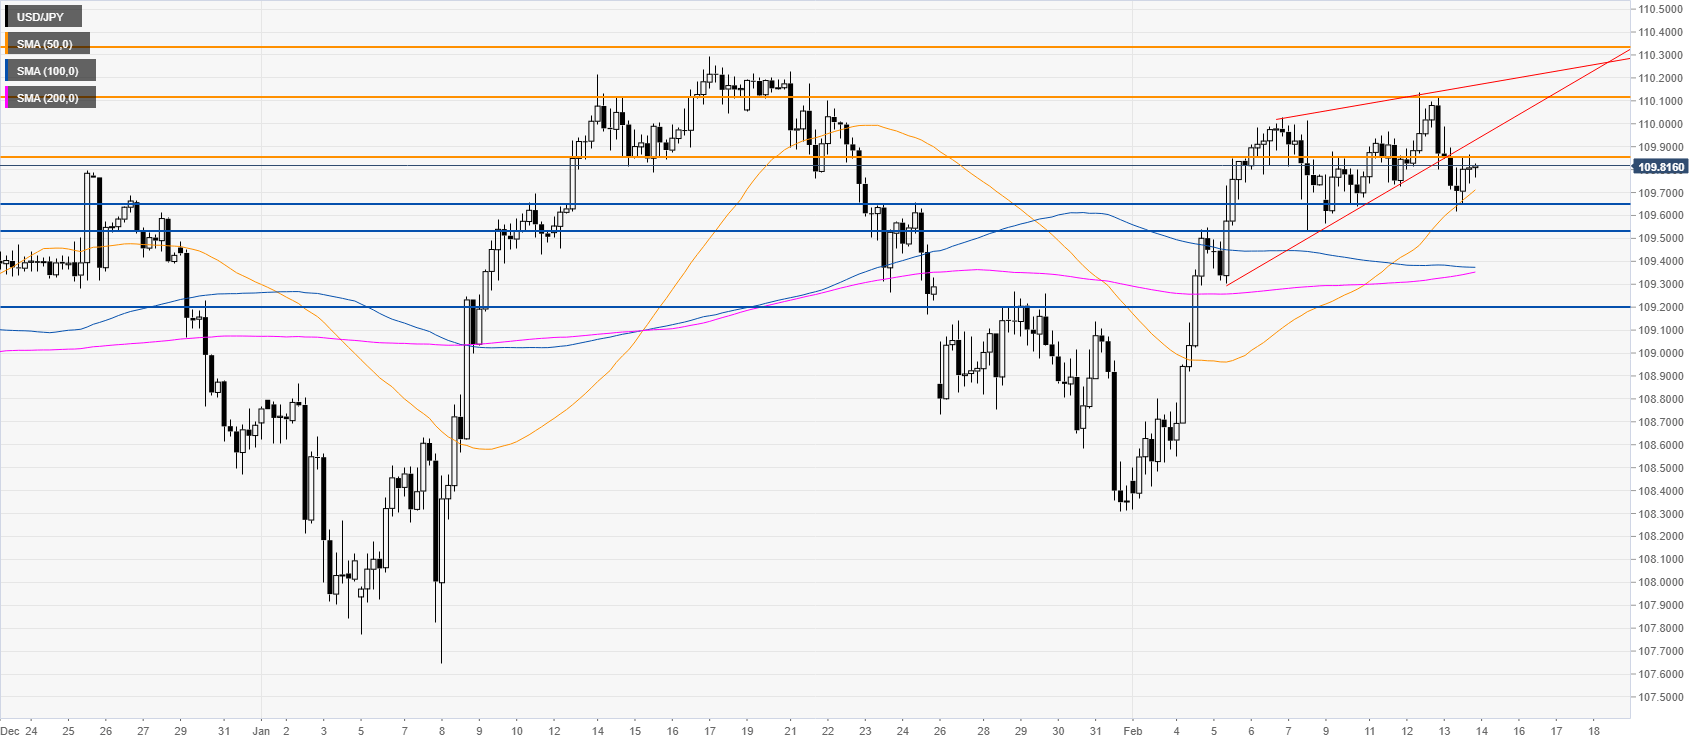
USD/JPY four-hour chart
USD/JPY broke below a rising wedge pattern while above the main SMAs. The spot is challenging the 109.85 resistance as bulls want to break above the level to revisit the 110.10 level. On the flip side, bears are eyeing a break below the 109.65/53 support zone to drop the market towards the 109.20 level, according to the Technical Confluences Indicator.
Additional key levels