US Dollar Index Price Analysis: Monday’s Doji teases DXY bears above 96.00
- DXY fails to extend four-day uptrend following a bearish candlestick formation.
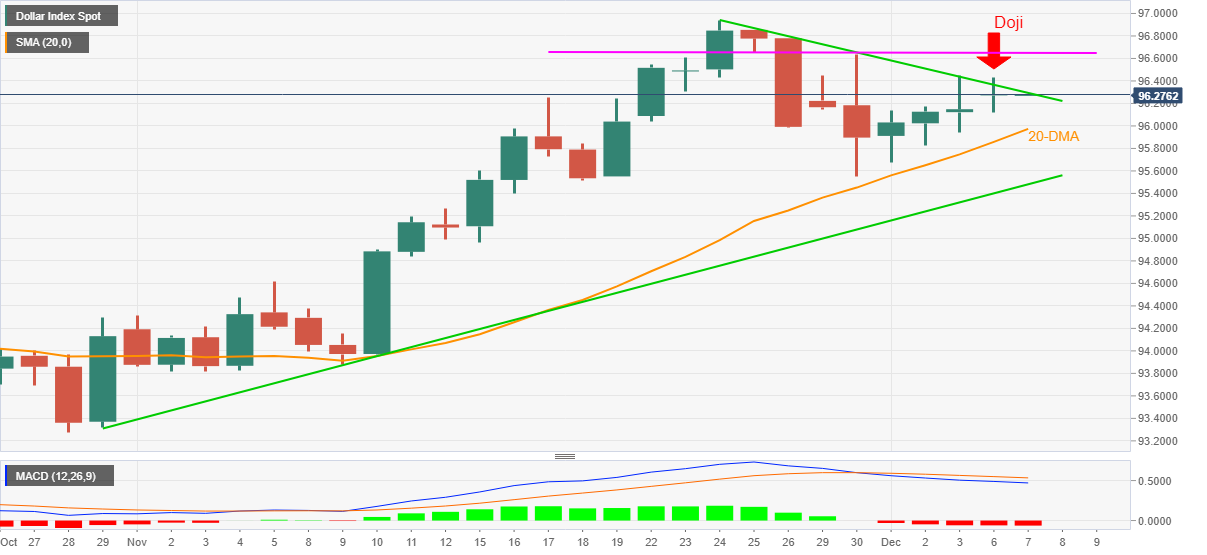
- Weekly resistance line, downbeat MACD signals also favor sellers.
- 20-DMA, five-week-old rising support line gain short-term seller’s attention.
US Dollar Index (DXY) begins Tuesday’s trading on a back foot, following a four-day run-up, around 96.28 by the press time.
In doing so, the greenback gauge justifies the previous day’s bearish candlestick formation while hugging tightly to a weekly resistance line. The bearish MACD signals also underpin the skepticism over the previous run-up.
The anticipated pullback, however, will be challenged by a 20-DMA level of 95.97, a break of which highlights an ascending support line from October 29, near 95.50.
Should the US Dollar Index breaks 95.50 support, it becomes vulnerable to test the early November tops near 94.60. During the fall, the 95.00 threshold can offer an intermediate halt.
Meanwhile, a clear upside break of the stated resistance line near 96.30 will need validation from 96.65 before directing DXY bulls towards the 97.00 psychological magnet.
To sum up, greenback bulls seem to have tired and hence the latest candlestick may play its role to trigger a pullback.
DXY: Daily chart
Trend: Pullback expected