WTI Price Analysis: 200-HMA challenges pullback moves above $97.00
- WTI crude oil extends pullback from two-week top as sellers attack 200-HMA.
- Bearish MACD signals, steady RSI favors further weakness.
- Short-term ascending triangle restricts immediate downside despite teasing “double top” bearish formation.
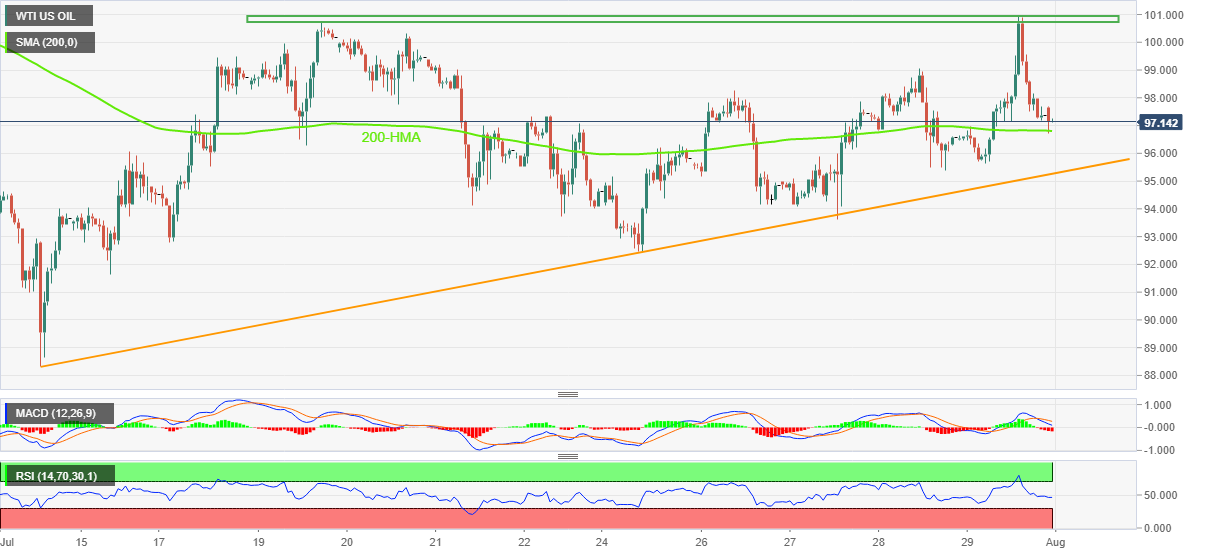
WTI crude oil prices retreat towards $97.00, after posting the biggest weekly gains in two months. However, the 200-HMA restricts the immediate downside of the black gold.
That said, the bearish MACD signals and the steady RSI keeps sellers hopeful inside a two-week-old ascending triangle formation.
It’s worth noting that the downside break of the stated triangle’s support, near $95.25, won’t be enough for the WTI bears to dominate as the July 25 swing low around $92.40 will be a confirmation point for the “double top” bearish pattern.
Should the quote drops below $92.40, it can direct WTI bears toward the theoretical target surrounding $84.00. However, July’s bottom near $88.30 may probe the downside move.
Alternatively, recovery remains elusive until the quote crosses the aforementioned triangle’s upper line, also the “double top”, near $100.80-$101.00.
Also acting as an upside filter is the July 08 high near $102.80, a break of which could convince buyers to challenge the previous monthly peak surrounding $109.50.
Overall, WTI crude oil prices are likely to witness a pullback but the bears need validation from $92.40.
WTI: Hourly chart
Trend: Limited downside expected